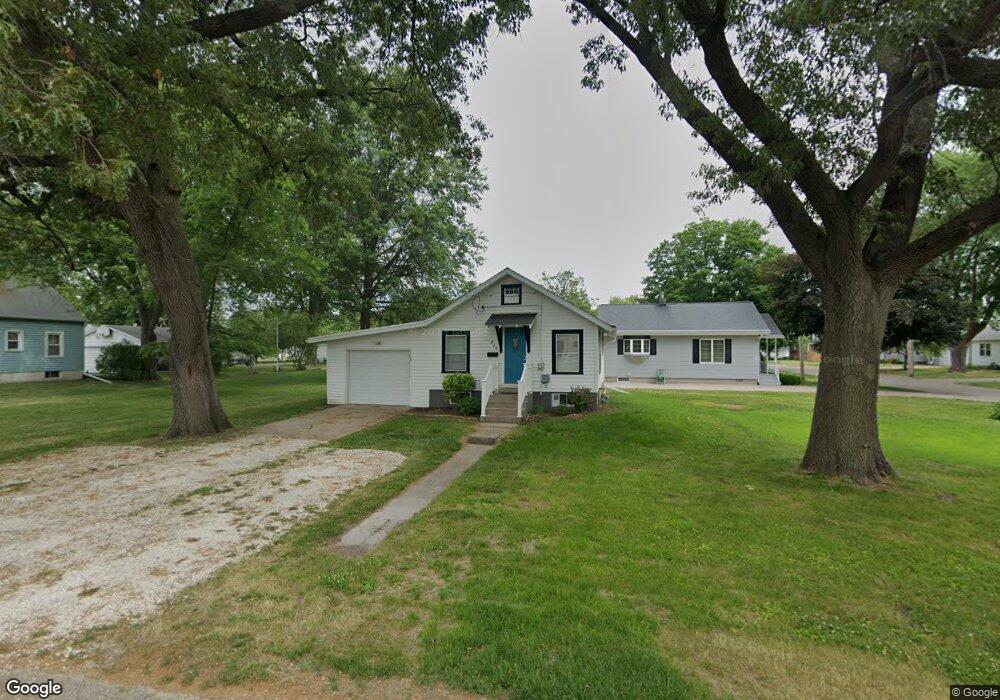
429 E Palace Row Geneseo, IL 61254
Estimated Value: $88,430 - $100,000
1
Bed
--
Bath
480
Sq Ft
$191/Sq Ft
Est. Value
About This Home
This home is located at 429 E Palace Row, Geneseo, IL 61254 and is currently estimated at $91,858, approximately $191 per square foot. 429 E Palace Row is a home located in Henry County with nearby schools including Geneseo High School and St. Malachy School.
Ownership History
Date
Name
Owned For
Owner Type
Purchase Details
Closed on
May 10, 2023
Sold by
Corgan Jesse M and Corgan Katrina L
Bought by
Reynolds Jace
Current Estimated Value
Home Financials for this Owner
Home Financials are based on the most recent Mortgage that was taken out on this home.
Original Mortgage
$16,000
Interest Rate
6.28%
Mortgage Type
New Conventional
Purchase Details
Closed on
Mar 25, 2022
Sold by
Brown Justin R and Brown Carlie M
Bought by
Corgan Jesse M and Corgan Katrina L
Purchase Details
Closed on
Mar 9, 2016
Sold by
Apperson Sharon
Bought by
Brown Justin R and Brown Carlie M
Home Financials for this Owner
Home Financials are based on the most recent Mortgage that was taken out on this home.
Original Mortgage
$37,000
Interest Rate
3.79%
Mortgage Type
Commercial
Create a Home Valuation Report for This Property
The Home Valuation Report is an in-depth analysis detailing your home's value as well as a comparison with similar homes in the area
Home Values in the Area
Average Home Value in this Area
Purchase History
| Date | Buyer | Sale Price | Title Company |
|---|---|---|---|
| Reynolds Jace | $80,000 | None Listed On Document | |
| Corgan Jesse M | $70,000 | None Listed On Document | |
| Corgan Jesse M | $70,000 | None Listed On Document | |
| Brown Justin R | $46,000 | Attorney |
Source: Public Records
Mortgage History
| Date | Status | Borrower | Loan Amount |
|---|---|---|---|
| Closed | Reynolds Jace | $16,000 | |
| Open | Reynolds Jace | $64,000 | |
| Previous Owner | Brown Justin R | $37,000 |
Source: Public Records
Tax History
| Year | Tax Paid | Tax Assessment Tax Assessment Total Assessment is a certain percentage of the fair market value that is determined by local assessors to be the total taxable value of land and additions on the property. | Land | Improvement |
|---|---|---|---|---|
| 2024 | $1,284 | $21,793 | $5,569 | $16,224 |
| 2023 | $1,098 | $19,848 | $5,072 | $14,776 |
| 2022 | $1,499 | $18,446 | $4,714 | $13,732 |
| 2021 | $1,469 | $17,979 | $4,595 | $13,384 |
| 2020 | $1,462 | $18,146 | $4,638 | $13,508 |
| 2019 | $1,416 | $17,944 | $4,586 | $13,358 |
| 2018 | $1,343 | $16,961 | $4,335 | $12,626 |
| 2017 | $1,263 | $16,531 | $4,225 | $12,306 |
| 2016 | $1,318 | $16,112 | $4,118 | $11,994 |
| 2015 | $1,215 | $16,080 | $4,110 | $11,970 |
| 2013 | $1,215 | $15,779 | $4,033 | $11,746 |
Source: Public Records
Map
Nearby Homes
- 225 E Wells St
- 522 N State St
- 19025 Bluff Rd
- 139 N Vail St
- 629 W Wells St
- 422 W Exchange St
- 308 N Stewart St
- 803 Darnall Dr
- 414 S Henry St
- 806 Book Ln
- 608 S Oakwood Ave
- 101 S Stewart St
- 819 Darnall Dr
- 825 Book Ln
- 826 Book Ln
- 721 Ash Dr
- 403 E Chestnut St
- 13978 N 2200th Ave
- 0 S Oakwood Ave Unit MRDQC4257560
- 224 Pin Oak Dr
- 407 N Williams St
- 421 E Palace Row
- 413 N Williams St
- 419 E Palace Row
- 324 N Williams St
- 402 N Williams St
- 412 N Williams St
- 420 E Palace Row
- 501 E Palace Row
- 418 N Williams St
- 413 E Palace Row
- 414 E Wells St
- 412 E Palace Row
- 418 E Wells St
- 410 E Wells St
- 405 E Palace Row
- 320 N Williams St
- 404 E Wells St
- 406 E Wells St
- 412 N Hill St
Your Personal Tour Guide
Ask me questions while you tour the home.