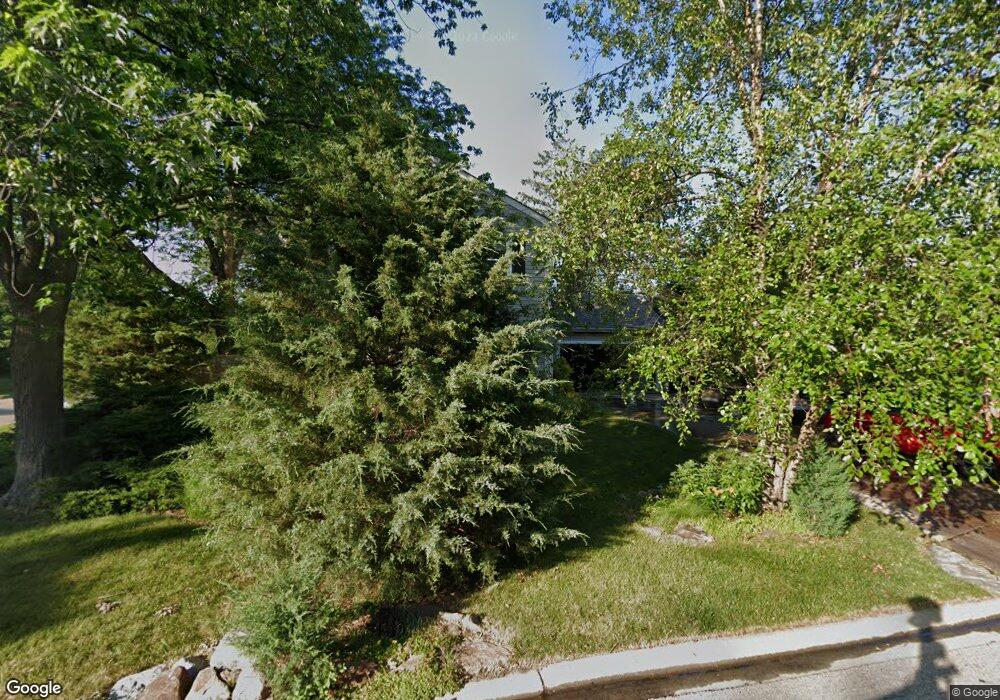
429 Elm Tree Ln Vernon Hills, IL 60061
Estimated Value: $478,473 - $539,000
--
Bed
3
Baths
2,172
Sq Ft
$234/Sq Ft
Est. Value
About This Home
This home is located at 429 Elm Tree Ln, Vernon Hills, IL 60061 and is currently estimated at $508,618, approximately $234 per square foot. 429 Elm Tree Ln is a home located in Lake County with nearby schools including Hawthorn School Of Dual Language, Hawthorn Aspen Elementary School, and Hawthorn Middle School South.
Ownership History
Date
Name
Owned For
Owner Type
Purchase Details
Closed on
Sep 10, 2025
Sold by
Kottmeyer Grant and Kottmeyer Patricia
Bought by
Grant Kottmeyer Living Trust and Patricia Kottmeyer Living Trust
Current Estimated Value
Purchase Details
Closed on
Aug 9, 1996
Sold by
Naslund Paul and Naslund Sara E
Bought by
Kottmeyer Grant and Kottmeyer Patricia
Home Financials for this Owner
Home Financials are based on the most recent Mortgage that was taken out on this home.
Original Mortgage
$170,000
Interest Rate
8.3%
Purchase Details
Closed on
Dec 21, 1995
Sold by
Naslund Paul
Bought by
Naslund Paul and Naslund Sara E
Purchase Details
Closed on
Jun 2, 1994
Sold by
Newton Larry E and Newton Janet M
Bought by
Naslund Paul
Home Financials for this Owner
Home Financials are based on the most recent Mortgage that was taken out on this home.
Original Mortgage
$159,700
Interest Rate
5.9%
Create a Home Valuation Report for This Property
The Home Valuation Report is an in-depth analysis detailing your home's value as well as a comparison with similar homes in the area
Home Values in the Area
Average Home Value in this Area
Purchase History
| Date | Buyer | Sale Price | Title Company |
|---|---|---|---|
| Grant Kottmeyer Living Trust | -- | None Listed On Document | |
| Kottmeyer Grant | $200,000 | -- | |
| Naslund Paul | -- | Chicago Title Insurance Co | |
| Naslund Paul | $177,500 | Chicago Title Insurance Co |
Source: Public Records
Mortgage History
| Date | Status | Borrower | Loan Amount |
|---|---|---|---|
| Previous Owner | Kottmeyer Grant | $170,000 | |
| Previous Owner | Naslund Paul | $159,700 |
Source: Public Records
Tax History Compared to Growth
Tax History
| Year | Tax Paid | Tax Assessment Tax Assessment Total Assessment is a certain percentage of the fair market value that is determined by local assessors to be the total taxable value of land and additions on the property. | Land | Improvement |
|---|---|---|---|---|
| 2024 | $10,868 | $134,372 | $28,852 | $105,520 |
| 2023 | $10,516 | $124,304 | $26,690 | $97,614 |
| 2022 | $10,516 | $119,058 | $25,563 | $93,495 |
| 2021 | $10,177 | $117,774 | $25,287 | $92,487 |
| 2020 | $10,020 | $118,176 | $25,373 | $92,803 |
| 2019 | $9,829 | $117,740 | $25,279 | $92,461 |
| 2018 | $9,300 | $113,038 | $24,984 | $88,054 |
| 2017 | $9,199 | $110,400 | $24,401 | $85,999 |
| 2016 | $8,916 | $105,717 | $23,366 | $82,351 |
| 2015 | $8,784 | $98,866 | $21,852 | $77,014 |
| 2014 | $8,654 | $95,968 | $23,470 | $72,498 |
| 2012 | $8,479 | $96,160 | $23,517 | $72,643 |
Source: Public Records
Map
Nearby Homes
- 14 Edgewood Rd
- 219 Abilene Ln
- 221 Alexandria Dr
- 717 Summit Ln
- 227 Augusta Dr
- 139 Windsor Dr Unit 123
- 307 Albright Ct
- 15 Tanwood Ct Unit 52B
- 15 Crestview Ln Unit 4
- 233 Harvest Ct
- 336 Westwood Ct Unit 42D
- 561 Saddlebrook Ln Unit 161
- 513 Saddlebrook Ln Unit 4
- 1028 Cumberland Ct
- 124 Midway Ln
- 414 Briarwood Ct Unit 1D
- 365 Jefferson Ct Unit 65
- 116 S Deerpath Dr
- 361 Ashwood Ct Unit 75D
- 128 Lilly Ct
- 427 Elm Tree Ln
- 17 Warrington Rd Unit 1
- 22 Warrington Rd
- 425 Elm Tree Ln
- 20 Warrington Rd
- 420 Elm Tree Ln
- 18 Warrington Rd
- 15 Warrington Rd
- 423 Elm Tree Ln
- 418 Elm Tree Ln
- 16 Warrington Rd
- 13 Warrington Rd
- 421 Elm Tree Ln
- 17 Mayflower Rd
- 501 Exeter Place
- 419 Elm Tree Ln
- 416 Elm Tree Ln
- 14 Warrington Rd Unit 1
- 15 Mayflower Rd
- 11 Warrington Rd