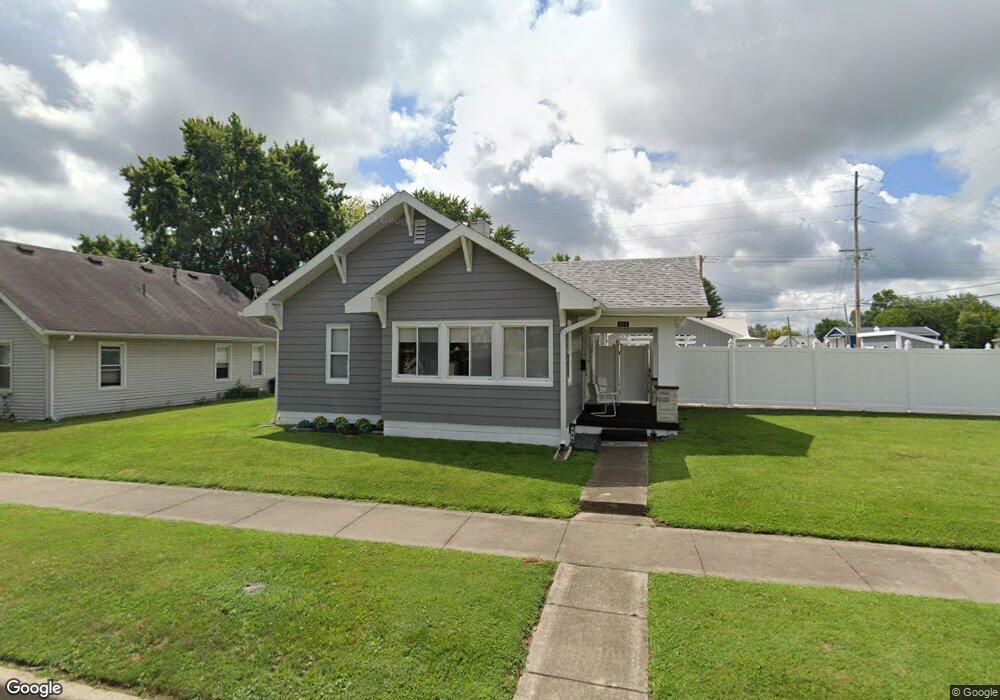
429 H St NE Linton, IN 47441
Estimated Value: $125,000 - $154,000
--
Bed
2
Baths
1,201
Sq Ft
$116/Sq Ft
Est. Value
About This Home
This home is located at 429 H St NE, Linton, IN 47441 and is currently estimated at $139,664, approximately $116 per square foot. 429 H St NE is a home located in Greene County with nearby schools including Linton-Stockton Elementary School, Linton-Stockton Junior High School, and Linton-Stockton High School.
Ownership History
Date
Name
Owned For
Owner Type
Purchase Details
Closed on
Oct 19, 2018
Sold by
Millick Kenneth I and Millick Elizabeth
Bought by
Millick Elizabeth
Current Estimated Value
Purchase Details
Closed on
Jul 1, 2010
Sold by
Gardner Chris A and Gardner Jeanine
Bought by
Millick Lowery D and Millick Phyllis L
Home Financials for this Owner
Home Financials are based on the most recent Mortgage that was taken out on this home.
Original Mortgage
$64,000
Interest Rate
4.83%
Mortgage Type
New Conventional
Purchase Details
Closed on
Nov 13, 2009
Sold by
Gupta Vinod and Hale Frank
Bought by
Wall Darcie
Home Financials for this Owner
Home Financials are based on the most recent Mortgage that was taken out on this home.
Original Mortgage
$27,600
Interest Rate
4.95%
Mortgage Type
New Conventional
Create a Home Valuation Report for This Property
The Home Valuation Report is an in-depth analysis detailing your home's value as well as a comparison with similar homes in the area
Home Values in the Area
Average Home Value in this Area
Purchase History
| Date | Buyer | Sale Price | Title Company |
|---|---|---|---|
| Millick Elizabeth | -- | None Available | |
| Millick Kenneth I | -- | None Available | |
| Millick Lowery D | -- | None Available | |
| Wall Darcie | -- | None Available |
Source: Public Records
Mortgage History
| Date | Status | Borrower | Loan Amount |
|---|---|---|---|
| Closed | Millick Lowery D | $64,000 | |
| Previous Owner | Wall Darcie | $27,600 |
Source: Public Records
Tax History Compared to Growth
Tax History
| Year | Tax Paid | Tax Assessment Tax Assessment Total Assessment is a certain percentage of the fair market value that is determined by local assessors to be the total taxable value of land and additions on the property. | Land | Improvement |
|---|---|---|---|---|
| 2024 | $774 | $76,200 | $11,500 | $64,700 |
| 2023 | $743 | $75,500 | $11,500 | $64,000 |
| 2022 | $776 | $77,600 | $11,500 | $66,100 |
| 2021 | $730 | $71,800 | $11,500 | $60,300 |
| 2020 | $713 | $70,700 | $11,500 | $59,200 |
| 2019 | $746 | $67,800 | $8,600 | $59,200 |
| 2018 | $784 | $71,600 | $8,600 | $63,000 |
| 2017 | $834 | $77,800 | $8,600 | $69,200 |
| 2016 | $783 | $76,400 | $8,700 | $67,700 |
| 2014 | $669 | $69,900 | $8,700 | $61,200 |
| 2013 | -- | $69,300 | $8,700 | $60,600 |
Source: Public Records
Map
Nearby Homes