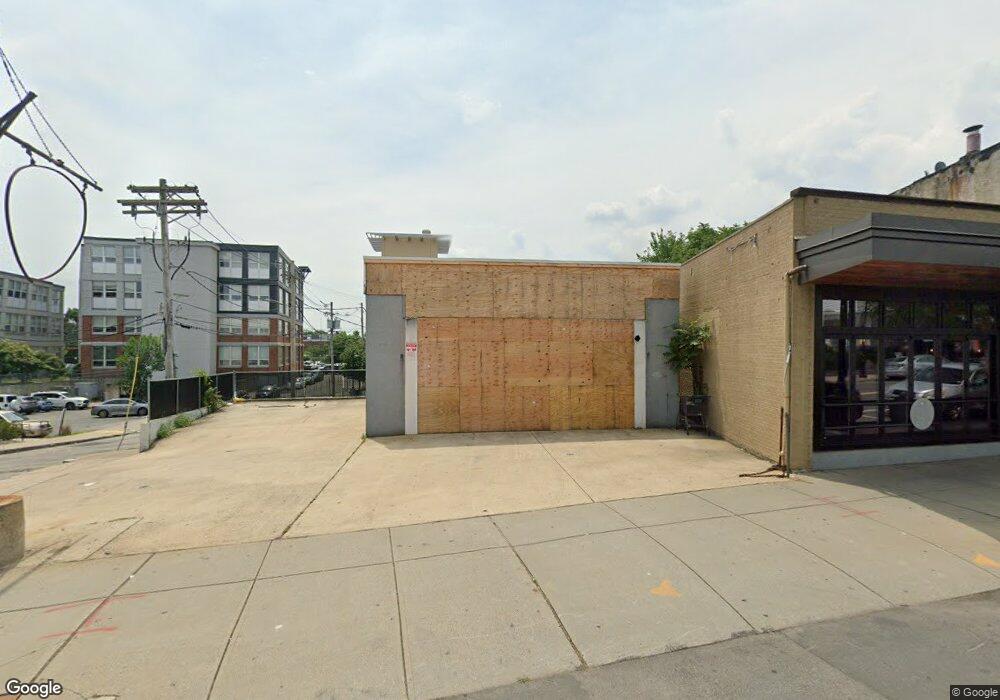
429 Hancock St Quincy, MA 02171
Montclair NeighborhoodEstimated Value: $1,397,986
--
Bed
1
Bath
2,300
Sq Ft
$608/Sq Ft
Est. Value
About This Home
This home is located at 429 Hancock St, Quincy, MA 02171 and is currently estimated at $1,397,986, approximately $607 per square foot. 429 Hancock St is a home located in Norfolk County with nearby schools including Montclair Elementary School, Atlantic Middle School, and North Quincy High School.
Ownership History
Date
Name
Owned For
Owner Type
Purchase Details
Closed on
Mar 9, 2020
Sold by
Doren David W
Bought by
10 Seconds Ma Llc
Current Estimated Value
Home Financials for this Owner
Home Financials are based on the most recent Mortgage that was taken out on this home.
Original Mortgage
$355,000
Outstanding Balance
$314,997
Interest Rate
3.6%
Mortgage Type
New Conventional
Estimated Equity
$1,082,989
Purchase Details
Closed on
Sep 15, 2003
Sold by
Tighe Thomas P
Bought by
Doren David W
Home Financials for this Owner
Home Financials are based on the most recent Mortgage that was taken out on this home.
Original Mortgage
$26,000
Interest Rate
6.22%
Mortgage Type
Commercial
Create a Home Valuation Report for This Property
The Home Valuation Report is an in-depth analysis detailing your home's value as well as a comparison with similar homes in the area
Home Values in the Area
Average Home Value in this Area
Purchase History
| Date | Buyer | Sale Price | Title Company |
|---|---|---|---|
| 10 Seconds Ma Llc | $940,000 | None Available | |
| Doren David W | $275,000 | -- |
Source: Public Records
Mortgage History
| Date | Status | Borrower | Loan Amount |
|---|---|---|---|
| Open | 10 Seconds Ma Llc | $355,000 | |
| Previous Owner | Doren David W | $26,000 |
Source: Public Records
Tax History Compared to Growth
Tax History
| Year | Tax Paid | Tax Assessment Tax Assessment Total Assessment is a certain percentage of the fair market value that is determined by local assessors to be the total taxable value of land and additions on the property. | Land | Improvement |
|---|---|---|---|---|
| 2025 | $21,777 | $946,400 | $659,800 | $286,600 |
| 2024 | $19,844 | $883,900 | $326,700 | $557,200 |
| 2023 | $19,024 | $857,700 | $323,400 | $534,300 |
| 2022 | $19,644 | $823,300 | $308,000 | $515,300 |
| 2021 | $11,551 | $476,900 | $305,000 | $171,900 |
| 2020 | $11,026 | $443,900 | $301,900 | $142,000 |
| 2019 | $11,104 | $441,000 | $299,000 | $142,000 |
| 2018 | $11,844 | $438,000 | $296,000 | $142,000 |
| 2017 | $12,127 | $422,400 | $287,300 | $135,100 |
| 2016 | $12,241 | $416,800 | $287,300 | $129,500 |
| 2015 | $12,709 | $420,000 | $287,300 | $132,700 |
| 2014 | $12,920 | $413,700 | $287,300 | $126,400 |
Source: Public Records
Map
Nearby Homes
- 17 Holmes St Unit 2
- 511 Hancock St Unit 207
- 522 Hancock St
- 21 Linden St Unit 417
- 143 Arlington St
- 43 Ellington Rd
- 85 E Squantum St Unit 10
- 1 Edwin St Unit C
- 115 W Squantum St Unit 907
- 115 W Squantum St Unit 810
- 204 Farrington St
- 237 Billings Rd
- 101 Beach St
- 22 Beach St
- 41 Davis St
- 65 - 67 Davis St
- 129 Beale St
- 150 Hancock St Unit 102
- 201 Billings St
- 365 Newport Ave Unit 301
- 11 Burgess St
- 425 Hancock St
- 419 Hancock St
- 417 Hancock St Unit 423
- 422 Hancock St Unit 7
- 422 Hancock St Unit 6
- 422 Hancock St Unit 5
- 422 Hancock St Unit 4
- 422 Hancock St Unit 3
- 422 Hancock St Unit 2
- 422 Hancock St Unit 4,422
- 92 Holmes St
- 118 Holmes St Unit 405
- 118 Holmes St Unit 404
- 118 Holmes St Unit 403
- 118 Holmes St Unit 402
- 118 Holmes St Unit 401
- 118 Holmes St Unit 305
- 118 Holmes St Unit 304
- 118 Holmes St Unit 303