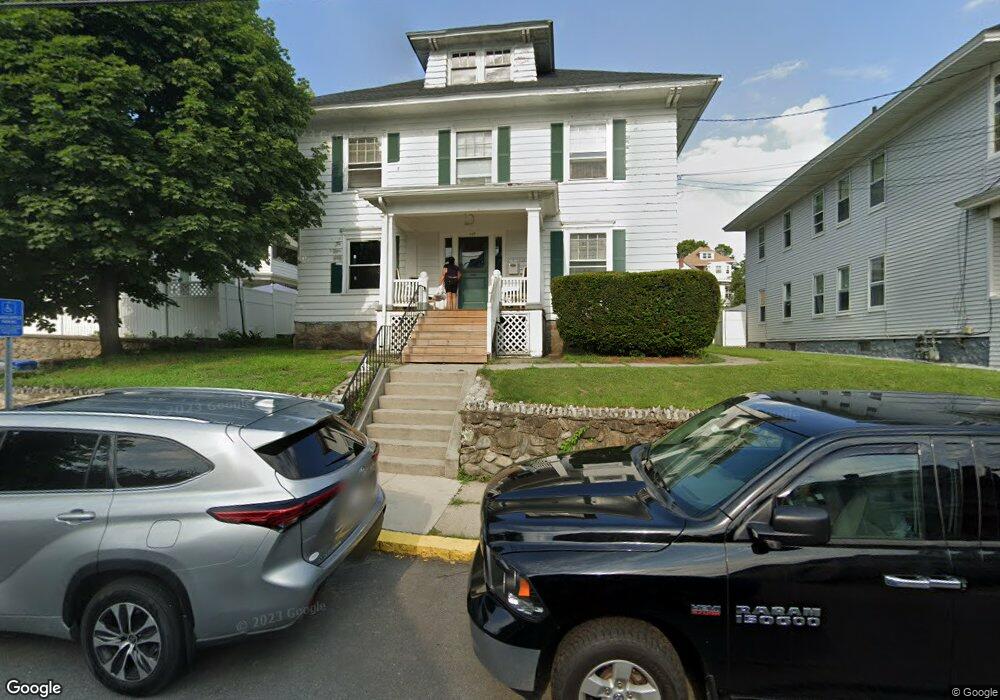
429 High St Lawrence, MA 01841
Prospect Hill-Back Bay NeighborhoodEstimated Value: $709,646 - $925,000
6
Beds
2
Baths
3,436
Sq Ft
$244/Sq Ft
Est. Value
About This Home
This home is located at 429 High St, Lawrence, MA 01841 and is currently estimated at $836,912, approximately $243 per square foot. 429 High St is a home located in Essex County with nearby schools including School For Exceptional Studies, Community Day Charter Public School - Gateway, and Esperanza Academy School of Hope.
Ownership History
Date
Name
Owned For
Owner Type
Purchase Details
Closed on
Jun 29, 2015
Sold by
Bonaccorsi 2Nd Edward A
Bought by
Summit Ft and Dupuis Noelle S
Current Estimated Value
Purchase Details
Closed on
Dec 16, 2005
Sold by
Seufert Dorothy R Est and Seufert
Bought by
Bonaccorsi Edward and Bonaccorsi Edward A
Home Financials for this Owner
Home Financials are based on the most recent Mortgage that was taken out on this home.
Original Mortgage
$279,000
Interest Rate
6.34%
Mortgage Type
Purchase Money Mortgage
Create a Home Valuation Report for This Property
The Home Valuation Report is an in-depth analysis detailing your home's value as well as a comparison with similar homes in the area
Home Values in the Area
Average Home Value in this Area
Purchase History
We collect this data history from publicly available records. To have your information removed, we recommend requesting removal directly through your county’s website.
| Date | Buyer | Sale Price | Title Company |
|---|---|---|---|
| Summit Ft | -- | -- | |
| Summit Ft | -- | -- | |
| Bonaccorsi Edward | $310,000 | -- | |
| Bonaccorsi Edward | $310,000 | -- |
Source: Public Records
Mortgage History
We collect this data history from publicly available records. To have your information removed, we recommend requesting removal directly through your county’s website.
| Date | Status | Borrower | Loan Amount |
|---|---|---|---|
| Previous Owner | Bonaccorsi Edward | $279,000 | |
| Previous Owner | Bonaccorsi Edward | $279,000 |
Source: Public Records
Tax History
| Year | Tax Paid | Tax Assessment Tax Assessment Total Assessment is a certain percentage of the fair market value that is determined by local assessors to be the total taxable value of land and additions on the property. | Land | Improvement |
|---|---|---|---|---|
| 2025 | $6,120 | $695,500 | $128,500 | $567,000 |
| 2024 | $5,949 | $643,100 | $124,200 | $518,900 |
| 2023 | $5,604 | $551,600 | $107,100 | $444,500 |
| 2022 | $5,026 | $439,300 | $99,400 | $339,900 |
| 2021 | $4,898 | $399,200 | $99,400 | $299,800 |
| 2020 | $4,715 | $379,300 | $79,700 | $299,600 |
| 2019 | $4,788 | $350,000 | $82,400 | $267,600 |
| 2018 | $4,180 | $291,900 | $75,000 | $216,900 |
| 2017 | $4,211 | $274,500 | $74,200 | $200,300 |
| 2016 | $3,887 | $250,600 | $49,400 | $201,200 |
| 2015 | $3,642 | $240,900 | $49,400 | $191,500 |
Source: Public Records
Map
Nearby Homes
- 106 E Haverhill St
- 229 Jackson St
- 20 Montgomery St
- 16 Quincy St
- 172 High St
- 264 E Haverhill St Unit 2
- 264 E Haverhill St Unit 4
- 7 Erhardt Terrace
- 128 East St
- 15 Bunkerhill St
- 83-87 Howard St
- 84 Howard St
- 10 Gloucester St
- 31 Dexter St
- 281 Essex St Unit 285
- 70 Marston St
- 46 Amesbury St Unit 2B
- 1 Riverview Blvd Unit 1-216
- 4 Chelmsford St
- 40-42 Holly St
- 412-414 High St
- 412 High St Unit 414
- 418 High St
- 6 Boehm St
- 2 Boehm St
- 422 High St
- 417 High St
- 424 High St
- 411 High St
- 423-425 High St
- 423 High St Unit 425
- 407 High St Unit 409
- 20 Boehm St
- 405 High St Unit A
- 22 Canton St Unit B
- 22 Canton St Unit A
- 22 Canton St
- 22 Canton St Unit 2
- 30 Canton St
- 403 High St Unit 405
Your Personal Tour Guide
Ask me questions while you tour the home.