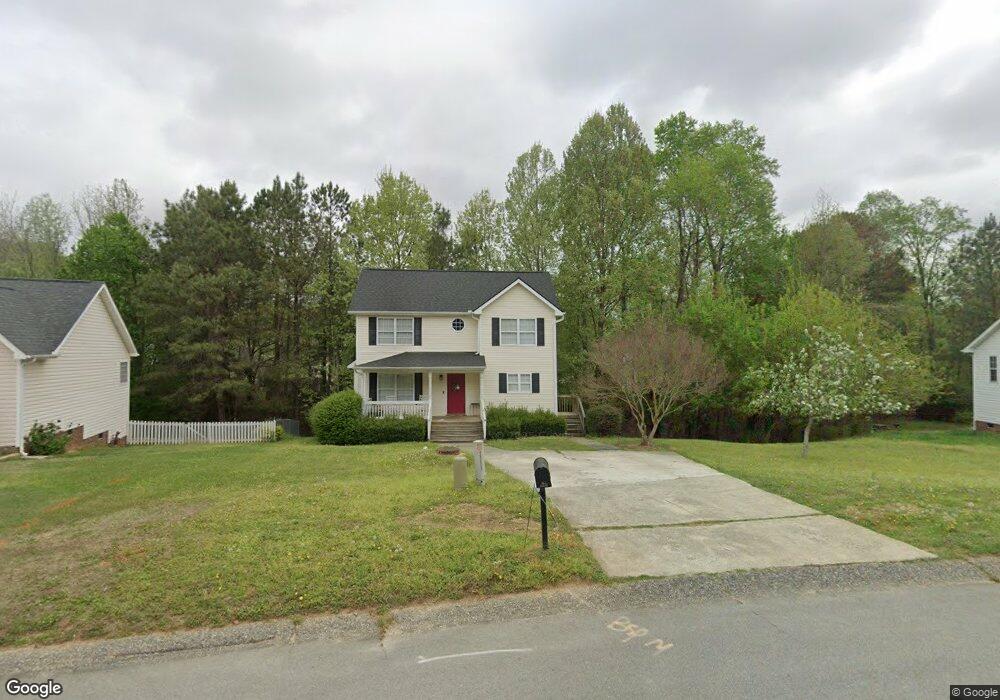
429 Indian Hill Rd Holly Springs, NC 27540
Estimated Value: $351,000 - $388,000
3
Beds
3
Baths
1,400
Sq Ft
$263/Sq Ft
Est. Value
About This Home
This home is located at 429 Indian Hill Rd, Holly Springs, NC 27540 and is currently estimated at $368,341, approximately $263 per square foot. 429 Indian Hill Rd is a home located in Wake County with nearby schools including Holly Springs Elementary School, Holly Ridge Middle School, and Holly Springs High School.
Ownership History
Date
Name
Owned For
Owner Type
Purchase Details
Closed on
Mar 9, 2016
Sold by
Wynn Jennifer and Wynn Jonathan
Bought by
Hulsizer Eric
Current Estimated Value
Home Financials for this Owner
Home Financials are based on the most recent Mortgage that was taken out on this home.
Original Mortgage
$179,948
Outstanding Balance
$146,259
Interest Rate
3.65%
Mortgage Type
New Conventional
Estimated Equity
$222,082
Purchase Details
Closed on
Jun 20, 2006
Sold by
Stafford Land Co Inc
Bought by
Wynn Jennifer A
Home Financials for this Owner
Home Financials are based on the most recent Mortgage that was taken out on this home.
Original Mortgage
$50,000
Interest Rate
6.6%
Mortgage Type
Unknown
Create a Home Valuation Report for This Property
The Home Valuation Report is an in-depth analysis detailing your home's value as well as a comparison with similar homes in the area
Home Values in the Area
Average Home Value in this Area
Purchase History
| Date | Buyer | Sale Price | Title Company |
|---|---|---|---|
| Hulsizer Eric | $178,000 | None Available | |
| Wynn Jennifer A | $135,500 | None Available |
Source: Public Records
Mortgage History
| Date | Status | Borrower | Loan Amount |
|---|---|---|---|
| Open | Hulsizer Eric | $179,948 | |
| Previous Owner | Wynn Jennifer A | $50,000 | |
| Previous Owner | Wynn Jennifer A | $85,500 |
Source: Public Records
Tax History Compared to Growth
Tax History
| Year | Tax Paid | Tax Assessment Tax Assessment Total Assessment is a certain percentage of the fair market value that is determined by local assessors to be the total taxable value of land and additions on the property. | Land | Improvement |
|---|---|---|---|---|
| 2025 | $3,185 | $367,816 | $130,000 | $237,816 |
| 2024 | $3,172 | $367,816 | $130,000 | $237,816 |
| 2023 | $2,444 | $224,739 | $70,000 | $154,739 |
| 2022 | $2,360 | $224,739 | $70,000 | $154,739 |
| 2021 | $2,316 | $224,739 | $70,000 | $154,739 |
| 2020 | $2,316 | $224,739 | $70,000 | $154,739 |
| 2019 | $2,052 | $168,898 | $50,000 | $118,898 |
| 2018 | $1,856 | $168,898 | $50,000 | $118,898 |
| 2017 | $1,789 | $168,898 | $50,000 | $118,898 |
| 2016 | $1,265 | $168,898 | $50,000 | $118,898 |
| 2015 | $1,604 | $150,957 | $38,000 | $112,957 |
| 2014 | $1,549 | $150,957 | $38,000 | $112,957 |
Source: Public Records
Map
Nearby Homes
- 144 Holly Mountain Rd
- 137 Lacombe Ct
- 109 Lacombe Ct
- 421 Grigsby Ave
- 705 Morton Farm Rd
- 401 Vista Springs Cir
- 417 Prince Dr
- 308 E Maple Ave
- 413 Rhamkatte Rd
- 504 Prince Dr
- 217 Jones Hill Rd
- 208 Old Ride Dr
- 220 Avent Ferry Rd
- 225 Seneca Shore Dr
- 225 Old Ride Dr
- 717 Utley St
- 404 Prince Dr
- 0 Old Ride Dr
- 204 Horncliffe Way
- 4014 Kentworth Dr
- 425 Indian Hill Rd
- 433 Indian Hill Rd
- 416 Birdsong Way
- 417 Birdsong Way
- 412 Birdsong Way
- 424 Indian Hill Rd
- 428 Indian Hill Rd
- 421 Indian Hill Rd
- 437 Indian Hill Rd
- 413 Birdsong Way
- 408 Birdsong Way
- 420 Indian Hill Rd
- 417 Indian Hill Rd
- 321 Buckfield Ln
- 501 Indian Hill Rd
- 409 Birdsong Way
- 500 Indian Hill Rd
- 212 Bateau Rd
- 104 Peakhill Rd
- 100 Peakhill Rd