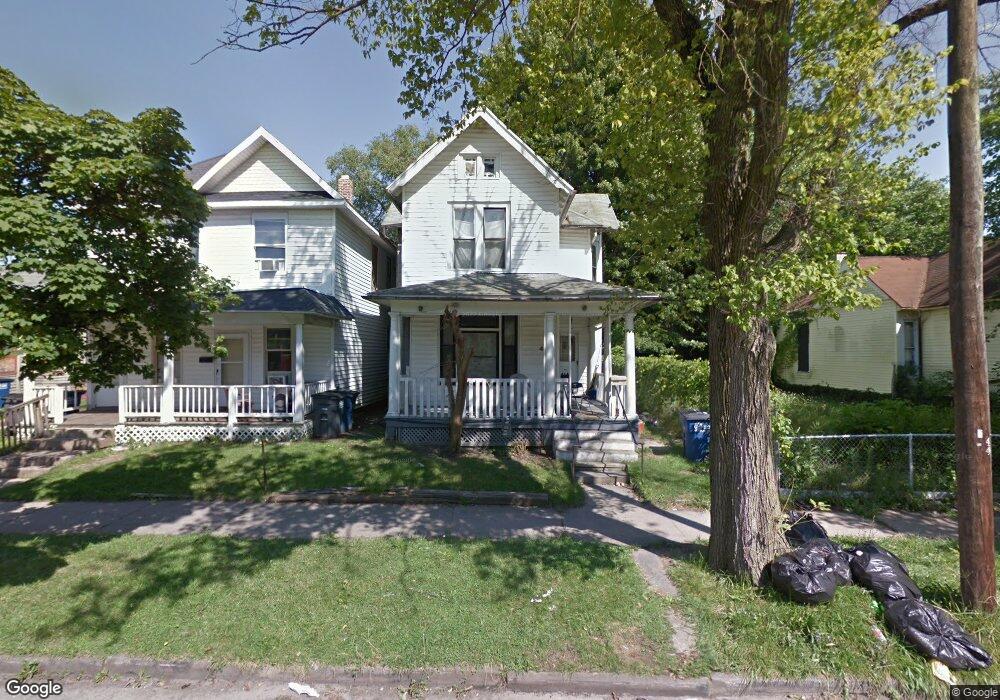
429 Langdon St Toledo, OH 43609
Southside NeighborhoodEstimated Value: $62,000 - $77,000
4
Beds
1
Bath
1,808
Sq Ft
$38/Sq Ft
Est. Value
About This Home
This home is located at 429 Langdon St, Toledo, OH 43609 and is currently estimated at $68,139, approximately $37 per square foot. 429 Langdon St is a home located in Lucas County with nearby schools including Marshall Stemm Academy, Jesup W. Scott High School, and Summit Academy - Toledo.
Ownership History
Date
Name
Owned For
Owner Type
Purchase Details
Closed on
Dec 3, 2019
Sold by
Steele Keith
Bought by
Garza Rosie A
Current Estimated Value
Purchase Details
Closed on
Oct 18, 2019
Sold by
Johnson Cherry Lynn
Bought by
Steele Keith
Purchase Details
Closed on
Jun 27, 2017
Sold by
Steek Keith
Bought by
Johnson Cherry Lynn
Purchase Details
Closed on
Oct 10, 2007
Sold by
Keesee Richard and Keesee Debra
Bought by
Steele Keith and Steele Kerri
Purchase Details
Closed on
Mar 18, 2004
Sold by
Slesinski David D and Slesinski Donna M
Bought by
Keesee Richard and Keesee Deborah
Home Financials for this Owner
Home Financials are based on the most recent Mortgage that was taken out on this home.
Original Mortgage
$310,000
Interest Rate
5.78%
Mortgage Type
Purchase Money Mortgage
Purchase Details
Closed on
May 12, 1997
Sold by
Sanchez Maryann
Bought by
Sutter Scott M
Create a Home Valuation Report for This Property
The Home Valuation Report is an in-depth analysis detailing your home's value as well as a comparison with similar homes in the area
Home Values in the Area
Average Home Value in this Area
Purchase History
| Date | Buyer | Sale Price | Title Company |
|---|---|---|---|
| Garza Rosie A | $5,900 | None Available | |
| Steele Keith | -- | None Available | |
| Johnson Cherry Lynn | $5,000 | None Available | |
| Steele Keith | $11,500 | Attorney | |
| Keesee Richard | $375,000 | Louisville Title Agency For | |
| Sutter Scott M | $8,000 | -- |
Source: Public Records
Mortgage History
| Date | Status | Borrower | Loan Amount |
|---|---|---|---|
| Previous Owner | Keesee Richard | $310,000 |
Source: Public Records
Tax History Compared to Growth
Tax History
| Year | Tax Paid | Tax Assessment Tax Assessment Total Assessment is a certain percentage of the fair market value that is determined by local assessors to be the total taxable value of land and additions on the property. | Land | Improvement |
|---|---|---|---|---|
| 2024 | $2,190 | $13,055 | $1,610 | $11,445 |
| 2023 | $763 | $10,640 | $1,470 | $9,170 |
| 2022 | $771 | $10,640 | $1,470 | $9,170 |
| 2021 | $780 | $10,640 | $1,470 | $9,170 |
| 2020 | $842 | $10,360 | $1,400 | $8,960 |
| 2019 | $848 | $10,360 | $1,400 | $8,960 |
| 2018 | $844 | $10,360 | $1,400 | $8,960 |
| 2017 | $875 | $10,115 | $1,365 | $8,750 |
| 2016 | $862 | $28,900 | $3,900 | $25,000 |
| 2015 | $850 | $28,900 | $3,900 | $25,000 |
| 2014 | $654 | $10,120 | $1,370 | $8,750 |
| 2013 | $654 | $10,120 | $1,370 | $8,750 |
Source: Public Records
Map
Nearby Homes
- 714 Walbridge Ave
- 511 Congress St
- 323 Langdon St
- 325 Chapin St
- 428 Havre St
- 641 South Ave
- 702 Boalt St
- 620 South Ave
- 872 Prouty Ave
- 816 Orchard St
- 642 Orchard St
- 713 Orchard St
- 578 Prouty Ave
- 616 Pleasant Place
- 925 Colburn St
- 616 Thayer St
- 763 Redwood Ave
- 765 Redwood Ave
- 223 Charles St
- 559 Prouty Ave
- 423 Langdon St
- 423 Langdon St Unit 1
- 419 Langdon St
- 433 Langdon St
- 415 Langdon St
- 437 Langdon St
- 426 Frank St
- 430 Frank St
- 424 Frank St
- 411 Langdon St
- 432 Frank St
- 420 Frank St
- 407 Langdon St
- 428 Langdon St
- 430 Langdon St
- 426 Langdon St
- 434 Langdon St
- 434 Langdon St Unit 2
- 424 Langdon St
- 416 Langdon St