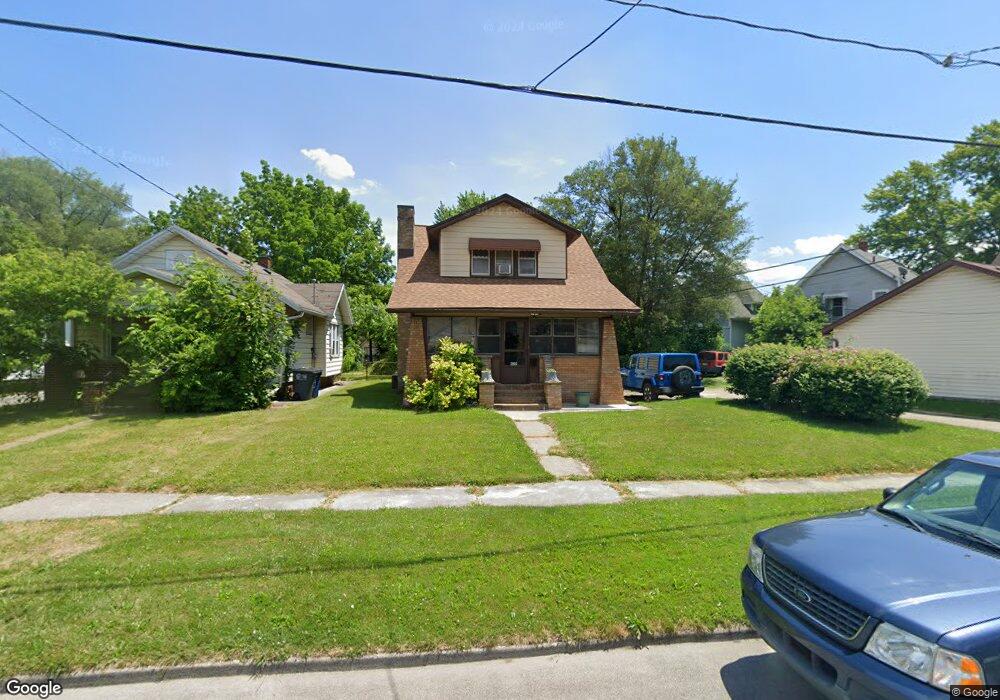
429 Mayberry St Toledo, OH 43609
Southside NeighborhoodEstimated Value: $76,000 - $94,000
2
Beds
1
Bath
1,052
Sq Ft
$81/Sq Ft
Est. Value
About This Home
This home is located at 429 Mayberry St, Toledo, OH 43609 and is currently estimated at $84,889, approximately $80 per square foot. 429 Mayberry St is a home located in Lucas County with nearby schools including Burroughs Elementary School, Bowsher High School, and Explorers Academy of Science and Technology.
Ownership History
Date
Name
Owned For
Owner Type
Purchase Details
Closed on
Aug 30, 2016
Sold by
Cian Corey and Cian Linda
Bought by
May Dave C and May Tina M
Current Estimated Value
Home Financials for this Owner
Home Financials are based on the most recent Mortgage that was taken out on this home.
Original Mortgage
$51,562
Outstanding Balance
$41,225
Interest Rate
3.46%
Mortgage Type
FHA
Estimated Equity
$43,664
Purchase Details
Closed on
Nov 23, 2005
Sold by
Hud
Bought by
Cain Corey and Cain Linda
Home Financials for this Owner
Home Financials are based on the most recent Mortgage that was taken out on this home.
Original Mortgage
$34,200
Interest Rate
6.48%
Mortgage Type
Fannie Mae Freddie Mac
Purchase Details
Closed on
Jul 6, 2005
Sold by
Flagstar Bank Fsb
Bought by
Hud
Purchase Details
Closed on
May 10, 2005
Sold by
Quertinmont Sara and Quertinmont Sara A
Bought by
Flagstar Bank Fsb
Purchase Details
Closed on
Jul 7, 2003
Sold by
Barry Simon E and Barry Nancy D
Bought by
Quertinmont Sara
Home Financials for this Owner
Home Financials are based on the most recent Mortgage that was taken out on this home.
Original Mortgage
$63,995
Interest Rate
5.37%
Mortgage Type
FHA
Create a Home Valuation Report for This Property
The Home Valuation Report is an in-depth analysis detailing your home's value as well as a comparison with similar homes in the area
Home Values in the Area
Average Home Value in this Area
Purchase History
| Date | Buyer | Sale Price | Title Company |
|---|---|---|---|
| May Dave C | $43,500 | Merestone Title Agency | |
| Cain Corey | $38,000 | Lakeside Title | |
| Hud | -- | -- | |
| Flagstar Bank Fsb | $43,334 | Ohio Title Corp | |
| Quertinmont Sara | $65,000 | -- |
Source: Public Records
Mortgage History
| Date | Status | Borrower | Loan Amount |
|---|---|---|---|
| Open | May Dave C | $51,562 | |
| Previous Owner | Cain Corey | $34,200 | |
| Previous Owner | Quertinmont Sara | $63,995 |
Source: Public Records
Tax History Compared to Growth
Tax History
| Year | Tax Paid | Tax Assessment Tax Assessment Total Assessment is a certain percentage of the fair market value that is determined by local assessors to be the total taxable value of land and additions on the property. | Land | Improvement |
|---|---|---|---|---|
| 2024 | $733 | $21,455 | $3,395 | $18,060 |
| 2023 | $1,256 | $17,150 | $3,325 | $13,825 |
| 2022 | $1,246 | $17,150 | $3,325 | $13,825 |
| 2021 | $1,217 | $17,150 | $3,325 | $13,825 |
| 2020 | $1,301 | $15,890 | $3,045 | $12,845 |
| 2019 | $1,254 | $15,890 | $3,045 | $12,845 |
| 2018 | $1,246 | $15,890 | $3,045 | $12,845 |
| 2017 | $1,328 | $15,540 | $2,975 | $12,565 |
| 2016 | $1,293 | $44,400 | $8,500 | $35,900 |
| 2015 | $1,219 | $44,400 | $8,500 | $35,900 |
| 2014 | $1,005 | $15,550 | $2,980 | $12,570 |
| 2013 | $1,005 | $15,550 | $2,980 | $12,570 |
Source: Public Records
Map
Nearby Homes
- 2126 Airport Hwy
- 440 Somerset St
- 321 Mayberry St
- 304 Mayberry St
- 226 Somerset St
- 531 Shasta Dr
- 221 Somerset St
- 556 Apple Ave
- 224 S Fearing Blvd
- 512 Woodsdale Ave
- 142 S Detroit Ave
- 1777 South Ave
- 649 Wright Ave
- 576 Bronx Dr
- 705 Wright Ave
- 1754 Finch St
- 140 Whiting Ave
- 885 National Ave
- 713 Geneva Ave
- 710 Durango Dr
- 423 Mayberry St
- 421 Mayberry St
- 2122 Airport Hwy
- 2136 Airport Hwy
- 2118 Airport Hwy
- 415 Mayberry St
- 2114 Airport Hwy
- 428 Mayberry St
- 430 Mayberry St
- 424 Mayberry St
- 411 Mayberry St
- 2110 Airport Hwy
- 416 Decatur St
- 420 Mayberry St
- 434 Mayberry St
- 2148 Airport Hwy
- 416 Mayberry St
- 2104 Airport Hwy
- 2119 Dana St
- 2117 Dana St