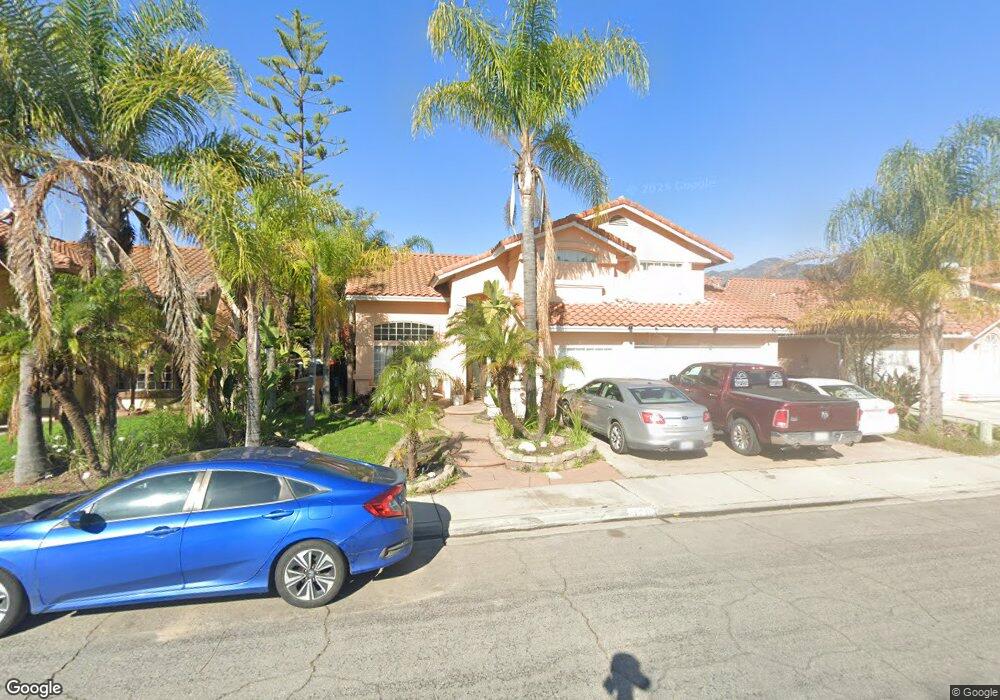
429 Mockingbird Ln Fillmore, CA 93015
Estimated Value: $752,000 - $801,000
About This Home
This home is located at 429 Mockingbird Ln, Fillmore, CA 93015 and is currently estimated at $782,369, approximately $419 per square foot. 429 Mockingbird Ln is a home located in Ventura County with nearby schools including Mountain Vista and Fillmore Senior High.
Ownership History
We collect this data history from publicly available records. To have your information removed, we recommend requesting removal directly through your county’s website.
Purchase Details
Home Financials for this Owner
Home Financials are based on the most recent Mortgage that was taken out on this home.Home Values in the Area
Average Home Value in this Area
Purchase History
We collect this data history from publicly available records. To have your information removed, we recommend requesting removal directly through your county’s website.
| Date | Buyer | Sale Price | Title Company |
|---|---|---|---|
| $245,000 | First American Title Ins Co |
Mortgage History
We collect this data history from publicly available records. To have your information removed, we recommend requesting removal directly through your county’s website.
| Date | Status | Borrower | Loan Amount |
|---|---|---|---|
| Open | $196,000 |
Tax History
We collect this data history from publicly available records. To have your information removed, we recommend requesting removal directly through your county’s website.
| Year | Tax Paid | Tax Assessment Tax Assessment Total Assessment is a certain percentage of the fair market value that is determined by local assessors to be the total taxable value of land and additions on the property. | Land | Improvement |
|---|---|---|---|---|
| 2025 | $5,196 | $438,715 | $150,611 | $288,104 |
| 2024 | $5,196 | $430,113 | $147,658 | $282,455 |
| 2023 | $5,149 | $421,680 | $144,763 | $276,917 |
| 2022 | $4,768 | $413,412 | $141,924 | $271,488 |
| 2021 | $5,356 | $405,306 | $139,141 | $266,165 |
| 2020 | $4,981 | $401,152 | $137,715 | $263,437 |
| 2019 | $4,986 | $393,287 | $135,015 | $258,272 |
| 2018 | $4,882 | $385,576 | $132,368 | $253,208 |
| 2017 | $4,899 | $378,017 | $129,773 | $248,244 |
| 2016 | $4,547 | $370,606 | $127,229 | $243,377 |
| 2015 | $4,422 | $365,041 | $125,319 | $239,722 |
| 2014 | $4,410 | $357,892 | $122,865 | $235,027 |
Map
- 1143 Los Serenos Dr
- 1129 1st St
- 320 D St
- 202 Avon Ln
- 553 Grapefruit Ln
- 989 Santa fe St
- 553 Sespe Ave
- 646 River St Unit D
- 815 Woodgrove Rd
- 809 Woodgrove Rd
- 404 Central Ave
- 1022 Shadow Ridge Way
- 1168 Shadow Ridge Way
- 1153 Shadow Ridge Way
- 1160 Shadow Ridge Way
- 340 Central Ave
- 300 Fillmore St
- 512 Mulberry Ln
- 639 Clay St
- 328 Clay St
- 417 Mockingbird Ln
- 423 Mockingbird Ln
- 411 Mockingbird Ln
- 428 Quail Ct
- 1204 Quail Ct
- 1155 Sespe Ave
- 432 Quail Ct
- 1148 Mockingbird Ln
- 416 Mockingbird Ln
- 422 Mockingbird Ln
- 435 Mockingbird Ln
- 1142 Mockingbird Ln
- 428 Mockingbird Ln
- 1206 Quail Ct
- 1185 Sespe Ave
- 438 Quail Ct
- 407 Sierra Vista Ave
- 1129 Mockingbird Ln
- 434 Mockingbird Ln
- 441 Mockingbird Ln
Ask me questions while you tour the home.