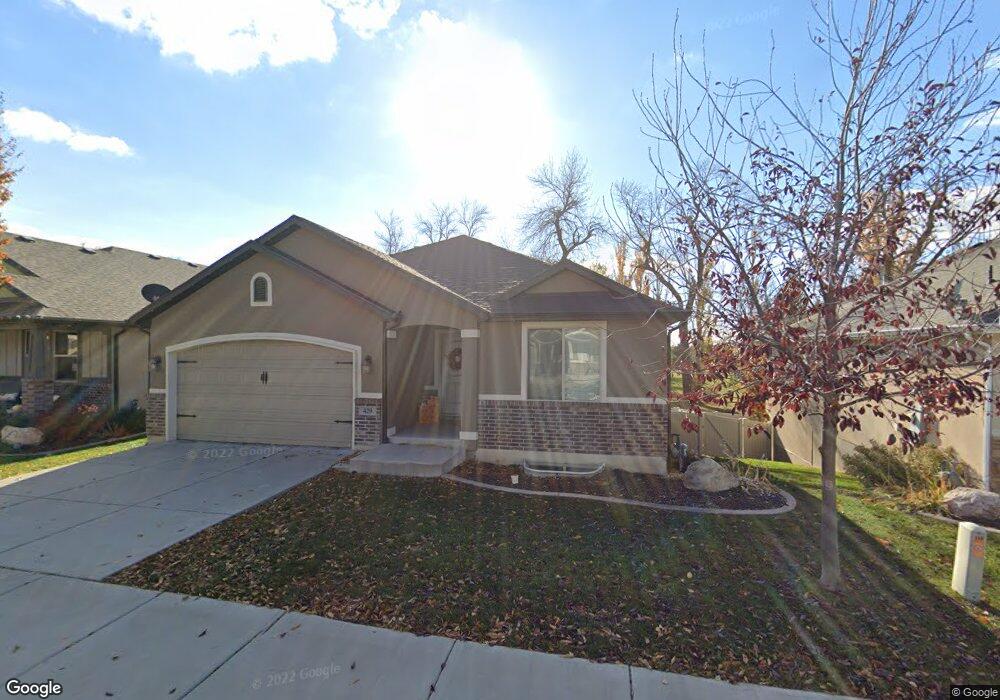
429 N 1025 E Layton, UT 84040
Estimated Value: $631,788 - $696,000
5
Beds
3
Baths
3,309
Sq Ft
$200/Sq Ft
Est. Value
About This Home
This home is located at 429 N 1025 E, Layton, UT 84040 and is currently estimated at $663,197, approximately $200 per square foot. 429 N 1025 E is a home located in Davis County with nearby schools including Whitesides Elementary School, Central Davis Junior High School, and Layton High School.
Ownership History
Date
Name
Owned For
Owner Type
Purchase Details
Closed on
Jun 29, 2020
Sold by
Scharffs Scott L and Scharffs Deborah P
Bought by
Kelley Michael and Kelley Nikkole
Current Estimated Value
Home Financials for this Owner
Home Financials are based on the most recent Mortgage that was taken out on this home.
Original Mortgage
$331,900
Outstanding Balance
$293,650
Interest Rate
3.1%
Mortgage Type
New Conventional
Estimated Equity
$369,547
Purchase Details
Closed on
May 6, 2016
Sold by
Curtis Austin M and Curtis Katelyn C
Bought by
Scharffs Scott L and Scharffs Deborah P
Create a Home Valuation Report for This Property
The Home Valuation Report is an in-depth analysis detailing your home's value as well as a comparison with similar homes in the area
Home Values in the Area
Average Home Value in this Area
Purchase History
| Date | Buyer | Sale Price | Title Company |
|---|---|---|---|
| Kelley Michael | -- | First American Title | |
| Scharffs Scott L | -- | Mountain View Title |
Source: Public Records
Mortgage History
| Date | Status | Borrower | Loan Amount |
|---|---|---|---|
| Open | Kelley Michael | $331,900 |
Source: Public Records
Tax History Compared to Growth
Tax History
| Year | Tax Paid | Tax Assessment Tax Assessment Total Assessment is a certain percentage of the fair market value that is determined by local assessors to be the total taxable value of land and additions on the property. | Land | Improvement |
|---|---|---|---|---|
| 2025 | $3,065 | $321,750 | $90,750 | $231,000 |
| 2024 | $2,934 | $310,200 | $57,750 | $252,450 |
| 2023 | $3,128 | $583,000 | $102,000 | $481,000 |
| 2022 | $3,293 | $333,300 | $59,950 | $273,350 |
| 2021 | $2,782 | $420,000 | $95,000 | $325,000 |
| 2020 | $2,493 | $361,000 | $69,500 | $291,500 |
| 2019 | $2,425 | $344,000 | $66,800 | $277,200 |
| 2018 | $2,388 | $340,000 | $66,800 | $273,200 |
| 2016 | $2,212 | $162,470 | $23,100 | $139,370 |
| 2015 | $2,170 | $151,305 | $23,100 | $128,205 |
| 2014 | $842 | $60,086 | $23,100 | $36,986 |
Source: Public Records
Map
Nearby Homes
- 508 N Adamswood Rd
- 880 E 350 N
- 556 N Fairfield Rd Unit A2
- 556 N Fairfield Rd Unit D1
- 556 N Fairfield Rd Unit D2
- 556 N Fairfield Rd Unit A3
- 556 N Fairfield Rd Unit D3
- 556 N Fairfield Rd Unit D4
- 556 N Fairfield Rd Unit A1
- 556 N Fairfield Rd Unit A4
- 861 E 575 N
- 1247 E 300 N
- 857 E 575 N
- 479 N 1375 E
- 580 N Allanwood Place
- 1503 E 530 N
- 654 Colonial St
- 942 E Gentile St
- 953 E 100 S
- 1515 E Gentile St