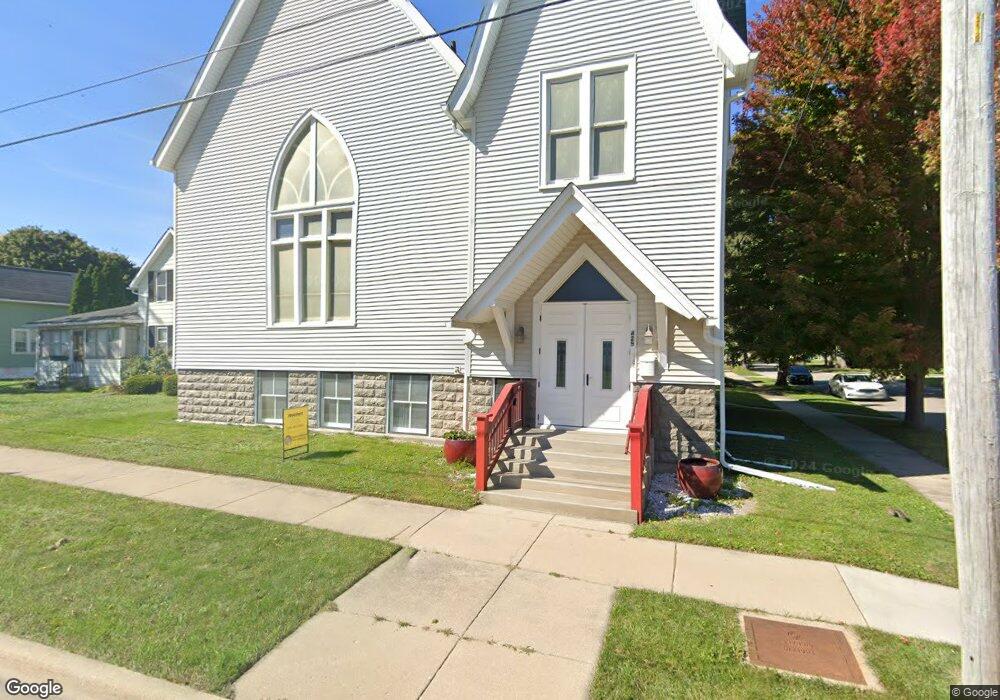
429 N 7th St Dekalb, IL 60115
Estimated Value: $202,011 - $219,000
Studio
--
Bath
--
Sq Ft
7,362
Sq Ft Lot
About This Home
This home is located at 429 N 7th St, Dekalb, IL 60115 and is currently estimated at $210,503. 429 N 7th St is a home located in DeKalb County with nearby schools including Littlejohn Elementary School, Clinton Rosette Middle School, and De Kalb High School.
Ownership History
Date
Name
Owned For
Owner Type
Purchase Details
Closed on
Nov 1, 2018
Sold by
Rich Shirley A
Bought by
Buster Willard G
Current Estimated Value
Home Financials for this Owner
Home Financials are based on the most recent Mortgage that was taken out on this home.
Original Mortgage
$85,200
Outstanding Balance
$53,670
Interest Rate
4.7%
Mortgage Type
New Conventional
Estimated Equity
$156,834
Purchase Details
Closed on
Dec 17, 2010
Sold by
Castle Bank Na
Bought by
Rich Harold S and Rich Shirley A
Purchase Details
Closed on
Aug 24, 2006
Sold by
Wisted James R
Bought by
Castle Bank Na
Home Financials for this Owner
Home Financials are based on the most recent Mortgage that was taken out on this home.
Original Mortgage
$106,500
Interest Rate
6.82%
Mortgage Type
New Conventional
Purchase Details
Closed on
Jul 28, 2006
Sold by
Wisted James R
Bought by
Wisted James R
Home Financials for this Owner
Home Financials are based on the most recent Mortgage that was taken out on this home.
Original Mortgage
$106,500
Interest Rate
6.82%
Mortgage Type
New Conventional
Create a Home Valuation Report for This Property
The Home Valuation Report is an in-depth analysis detailing your home's value as well as a comparison with similar homes in the area
Home Values in the Area
Average Home Value in this Area
Purchase History
| Date | Buyer | Sale Price | Title Company |
|---|---|---|---|
| Buster Willard G | $106,500 | None Available | |
| Rich Harold S | $104,000 | -- | |
| Castle Bank Na | -- | -- | |
| Wisted James R | -- | -- |
Source: Public Records
Mortgage History
| Date | Status | Borrower | Loan Amount |
|---|---|---|---|
| Open | Buster Willard G | $85,200 | |
| Previous Owner | Wisted James R | $106,500 |
Source: Public Records
Tax History
| Year | Tax Paid | Tax Assessment Tax Assessment Total Assessment is a certain percentage of the fair market value that is determined by local assessors to be the total taxable value of land and additions on the property. | Land | Improvement |
|---|---|---|---|---|
| 2024 | $3,748 | $52,548 | $10,831 | $41,717 |
| 2023 | $3,748 | $45,818 | $9,444 | $36,374 |
| 2022 | $3,621 | $41,831 | $10,777 | $31,054 |
| 2021 | $3,678 | $39,234 | $10,108 | $29,126 |
| 2020 | $3,750 | $38,609 | $9,947 | $28,662 |
| 2019 | $3,649 | $37,092 | $9,556 | $27,536 |
| 2018 | $2,945 | $35,834 | $9,232 | $26,602 |
| 2017 | $2,592 | $34,445 | $8,874 | $25,571 |
| 2016 | $2,630 | $33,575 | $8,650 | $24,925 |
| 2015 | -- | $31,813 | $8,196 | $23,617 |
| 2014 | -- | $32,222 | $11,858 | $20,364 |
| 2013 | -- | $33,847 | $12,456 | $21,391 |
Source: Public Records
Map
Nearby Homes
- SE Corner of 10th & Oak St
- 607 N 9th St
- 1015 Market St
- 1112 Market St
- TBD Illinois 23
- 315 E Lincoln Hwy
- 917 N 7th St
- 733 N 13th St
- 542 Sycamore Rd
- 717 N 1st St
- 204 W Locust St
- 305 College Ave
- 223 W Locust St
- 230 Augusta Ave
- 139 Elm St
- 126 Park Ave
- 100 Park Ave
- 938 E Garden St
- 356 Augusta Ave
- 345 Augusta Ave
Your Personal Tour Guide
Ask me questions while you tour the home.