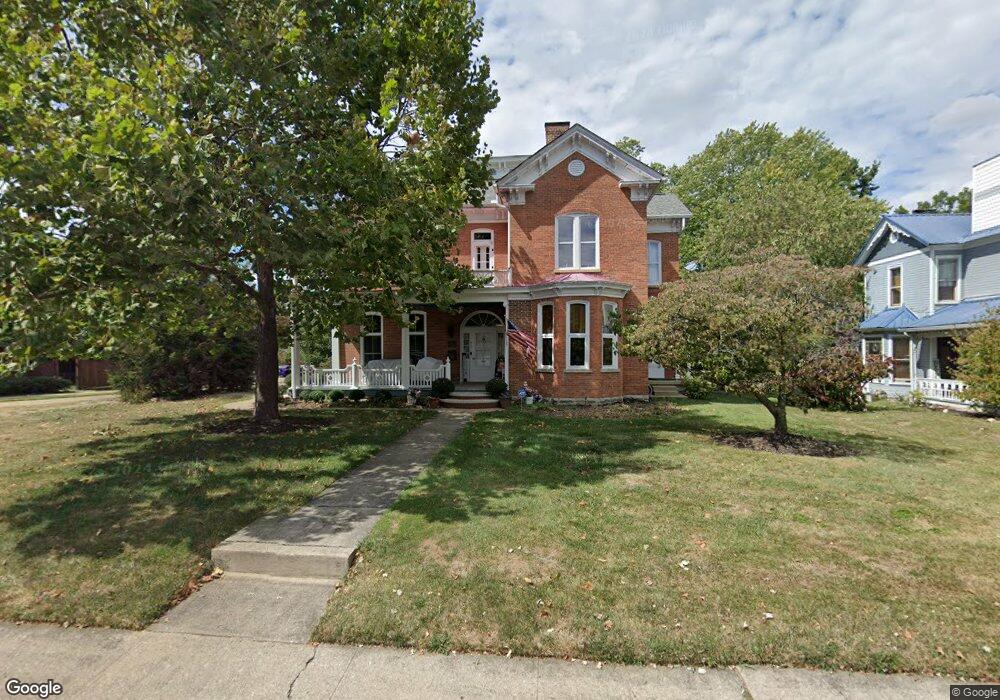
429 N Main St Georgetown, OH 45121
Estimated Value: $245,000 - $289,000
3
Beds
2
Baths
2,148
Sq Ft
$123/Sq Ft
Est. Value
About This Home
This home is located at 429 N Main St, Georgetown, OH 45121 and is currently estimated at $264,211, approximately $123 per square foot. 429 N Main St is a home located in Brown County with nearby schools including Georgetown Elementary School and Georgetown Jr/Sr High School.
Ownership History
Date
Name
Owned For
Owner Type
Purchase Details
Closed on
May 27, 2022
Sold by
Wood Development Properties Llc
Bought by
Segrist Andrew and Segrist Laura
Current Estimated Value
Home Financials for this Owner
Home Financials are based on the most recent Mortgage that was taken out on this home.
Original Mortgage
$254,308
Outstanding Balance
$241,975
Interest Rate
5.27%
Mortgage Type
New Conventional
Estimated Equity
$22,236
Purchase Details
Closed on
Oct 2, 2015
Sold by
Wood Nicholas D and Wood Edward L
Bought by
Wood Development Properties Llc
Purchase Details
Closed on
Mar 23, 2015
Sold by
Wood Edward L
Bought by
Wood Larry J and Wood Edward L
Create a Home Valuation Report for This Property
The Home Valuation Report is an in-depth analysis detailing your home's value as well as a comparison with similar homes in the area
Home Values in the Area
Average Home Value in this Area
Purchase History
| Date | Buyer | Sale Price | Title Company |
|---|---|---|---|
| Segrist Andrew | $10,500 | None Listed On Document | |
| Wood Development Properties Llc | -- | Attorney | |
| Wood Larry J | -- | None Available |
Source: Public Records
Mortgage History
| Date | Status | Borrower | Loan Amount |
|---|---|---|---|
| Open | Segrist Andrew | $254,308 |
Source: Public Records
Tax History
| Year | Tax Paid | Tax Assessment Tax Assessment Total Assessment is a certain percentage of the fair market value that is determined by local assessors to be the total taxable value of land and additions on the property. | Land | Improvement |
|---|---|---|---|---|
| 2024 | $2,565 | $70,760 | $1,550 | $69,210 |
| 2023 | $2,566 | $42,000 | $1,310 | $40,690 |
| 2022 | $1,656 | $42,000 | $1,310 | $40,690 |
| 2021 | $1,641 | $42,000 | $1,310 | $40,690 |
| 2020 | $1,452 | $35,020 | $1,100 | $33,920 |
| 2019 | $1,442 | $35,020 | $1,100 | $33,920 |
| 2018 | $1,432 | $35,020 | $1,100 | $33,920 |
| 2017 | $1,028 | $29,660 | $1,200 | $28,460 |
| 2016 | $1,028 | $29,660 | $1,200 | $28,460 |
| 2015 | $1,081 | $29,660 | $1,200 | $28,460 |
| 2014 | $1,081 | $29,560 | $1,100 | $28,460 |
| 2013 | $1,078 | $29,560 | $1,100 | $28,460 |
Source: Public Records
Map
Nearby Homes
- 405 N Main St
- 508 Mount Orab Pike
- 399 Elmwood Ct
- 406 E North St
- 60 New St
- 427 Kenwood Ave
- 1 N Kenwood Ave
- 510 W State St
- 2 N Kenwood Ave
- 505 S Water St
- 666 E State St
- 708 E State St
- 0 St Rt 221 & Footbridge Unit 1826509
- 155 Free Soil Rd
- 20 Heritage Hill Dr
- 175 Douglas Cir
- 38 Dell Acres Dr
- 3486 Barnes Rd
- 0 Barnes Rd Unit 1851215
- 4279 Sunshine Rd
Your Personal Tour Guide
Ask me questions while you tour the home.