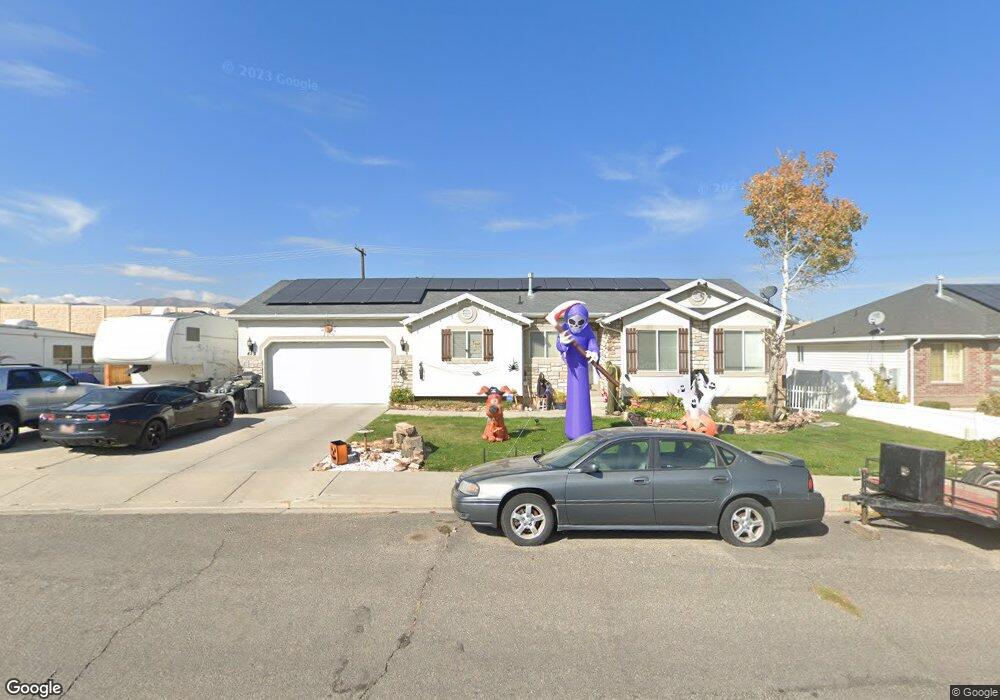
429 Nebeker Ln Payson, UT 84651
Estimated Value: $453,000 - $493,481
3
Beds
2
Baths
2,850
Sq Ft
$167/Sq Ft
Est. Value
About This Home
This home is located at 429 Nebeker Ln, Payson, UT 84651 and is currently estimated at $476,827, approximately $167 per square foot. 429 Nebeker Ln is a home located in Utah County with nearby schools including Taylor Elementary School, Salem Junior High School, and Valley View Middle School.
Ownership History
Date
Name
Owned For
Owner Type
Purchase Details
Closed on
Mar 6, 2024
Sold by
Watnes Debbie
Bought by
Debra B Watnes Living Trust and Watnes
Current Estimated Value
Purchase Details
Closed on
Sep 30, 2005
Sold by
Silver Ridge Homes Llc
Bought by
Watnes Dale and Watnes Debbie
Home Financials for this Owner
Home Financials are based on the most recent Mortgage that was taken out on this home.
Original Mortgage
$152,910
Interest Rate
5.72%
Mortgage Type
Fannie Mae Freddie Mac
Purchase Details
Closed on
Oct 18, 2002
Sold by
Foothill Park Lc
Bought by
Had Investments Llc
Create a Home Valuation Report for This Property
The Home Valuation Report is an in-depth analysis detailing your home's value as well as a comparison with similar homes in the area
Home Values in the Area
Average Home Value in this Area
Purchase History
| Date | Buyer | Sale Price | Title Company |
|---|---|---|---|
| Debra B Watnes Living Trust | -- | None Listed On Document | |
| Watnes Dale | -- | Brighton Title | |
| Silver Ridge Homes Llc | -- | Brighton Title | |
| Had Investments Llc | -- | Affiliated First Title |
Source: Public Records
Mortgage History
| Date | Status | Borrower | Loan Amount |
|---|---|---|---|
| Previous Owner | Watnes Dale | $152,910 |
Source: Public Records
Tax History
| Year | Tax Paid | Tax Assessment Tax Assessment Total Assessment is a certain percentage of the fair market value that is determined by local assessors to be the total taxable value of land and additions on the property. | Land | Improvement |
|---|---|---|---|---|
| 2025 | $2,273 | $244,145 | -- | -- |
| 2024 | $2,273 | $231,275 | $0 | $0 |
| 2023 | $2,317 | $236,445 | $0 | $0 |
| 2022 | $2,254 | $226,270 | $0 | $0 |
| 2021 | $1,912 | $307,800 | $85,900 | $221,900 |
| 2020 | $1,815 | $285,900 | $78,100 | $207,800 |
| 2019 | $1,688 | $272,600 | $69,900 | $202,700 |
| 2018 | $1,639 | $255,100 | $62,500 | $192,600 |
| 2017 | $1,541 | $128,975 | $0 | $0 |
| 2016 | $1,501 | $124,850 | $0 | $0 |
| 2015 | $1,341 | $110,715 | $0 | $0 |
| 2014 | $1,236 | $102,795 | $0 | $0 |
Source: Public Records
Map
Nearby Homes
Your Personal Tour Guide
Ask me questions while you tour the home.