Estimated Value: $185,000 - $206,000
3
Beds
2
Baths
2,100
Sq Ft
$93/Sq Ft
Est. Value
About This Home
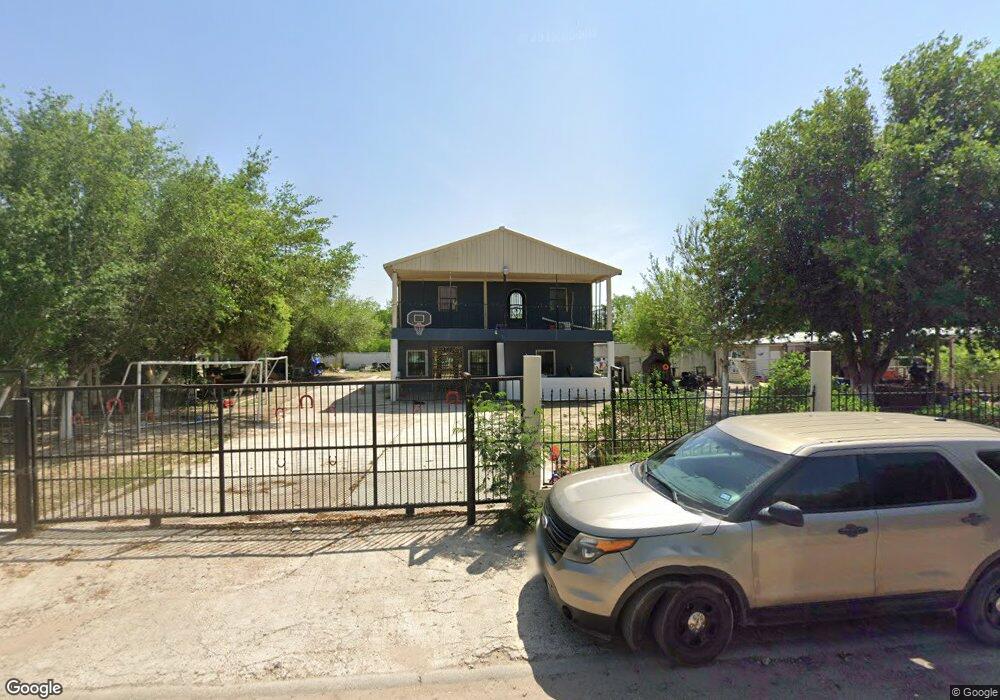
This home is located at 429 Puma Dr, Alamo, TX 78516 and is currently estimated at $195,561, approximately $93 per square foot. 429 Puma Dr is a home located in Hidalgo County with nearby schools including M. Rivas Elementary School, A.P. Solis Middle School, and Donna High School.
Ownership History
Date
Name
Owned For
Owner Type
Purchase Details
Closed on
Oct 13, 2020
Sold by
Buena Tierra Development Inc
Bought by
Gonzalez Maritza L
Current Estimated Value
Home Financials for this Owner
Home Financials are based on the most recent Mortgage that was taken out on this home.
Original Mortgage
$29,450
Outstanding Balance
$26,146
Interest Rate
2.8%
Mortgage Type
New Conventional
Estimated Equity
$169,415
Purchase Details
Closed on
Jul 16, 2012
Sold by
Swb Rgv Ventures Ltd
Bought by
Gonzalez Esmeralda N
Home Financials for this Owner
Home Financials are based on the most recent Mortgage that was taken out on this home.
Original Mortgage
$34,400
Interest Rate
3.68%
Mortgage Type
Seller Take Back
Purchase Details
Closed on
Jan 30, 2012
Sold by
El Gato Partnership
Bought by
Gonzalez Martin and Gonzalez Maria D
Create a Home Valuation Report for This Property
The Home Valuation Report is an in-depth analysis detailing your home's value as well as a comparison with similar homes in the area
Home Values in the Area
Average Home Value in this Area
Purchase History
| Date | Buyer | Sale Price | Title Company |
|---|---|---|---|
| Gonzalez Maritza L | -- | None Available | |
| Gonzalez Esmeralda N | -- | None Available | |
| Gonzalez Martin | -- | None Available |
Source: Public Records
Mortgage History
| Date | Status | Borrower | Loan Amount |
|---|---|---|---|
| Open | Gonzalez Maritza L | $29,450 | |
| Previous Owner | Gonzalez Esmeralda N | $34,400 |
Source: Public Records
Tax History Compared to Growth
Tax History
| Year | Tax Paid | Tax Assessment Tax Assessment Total Assessment is a certain percentage of the fair market value that is determined by local assessors to be the total taxable value of land and additions on the property. | Land | Improvement |
|---|---|---|---|---|
| 2025 | $1,631 | $148,766 | -- | -- |
| 2024 | $1,631 | $135,242 | $33,591 | $101,651 |
| 2023 | $2,685 | $135,069 | $0 | $0 |
| 2022 | $2,514 | $122,790 | $0 | $0 |
| 2021 | $2,307 | $111,627 | $33,591 | $78,036 |
| 2020 | $2,215 | $102,825 | $33,591 | $69,234 |
| 2019 | $2,207 | $100,977 | $33,591 | $67,386 |
| 2018 | $2,230 | $101,682 | $33,591 | $68,091 |
| 2017 | $2,136 | $96,876 | $33,591 | $69,498 |
| 2016 | $1,440 | $65,313 | $26,873 | $38,440 |
| 2015 | $1,222 | $65,688 | $26,873 | $38,815 |
Source: Public Records
Map
Nearby Homes
- 428 El Gato Rd
- 517 Tower Oak Dr
- 323 San Angelo Dr
- 611 Tower Oak Dr
- 519 Tower Oak Dr
- 613 Tower Oak Dr
- 507 Tower Oak Dr
- 530 Jaguar Dr
- 514 Tower Oak Dr
- 1233 S 2nd St
- 324 San Vicente Dr
- 1293 S 3rd St
- 408 Rene St
- 321 Rancho Blanco Rd
- 1118 Esparanza St
- 715 Pauli Ave
- 1310 S 9th St
- 1314 Carlos Dr
- 1311 Carlos Dr
- 1309 Carlos Dr