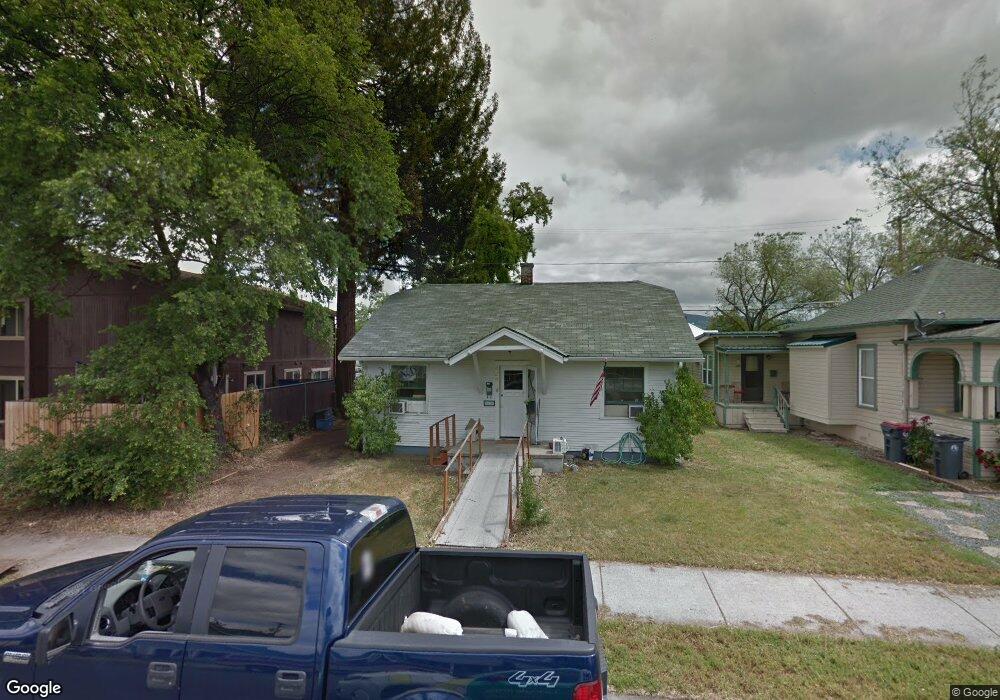
429 S Grape St Medford, OR 97501
Estimated Value: $243,000 - $282,000
2
Beds
1
Bath
900
Sq Ft
$289/Sq Ft
Est. Value
About This Home
This home is located at 429 S Grape St, Medford, OR 97501 and is currently estimated at $260,453, approximately $289 per square foot. 429 S Grape St is a home located in Jackson County with nearby schools including Jefferson Elementary School, McLoughlin Middle School, and South Medford High School.
Ownership History
Date
Name
Owned For
Owner Type
Purchase Details
Closed on
Sep 24, 2020
Sold by
Premo Edward A and Premo Barbar
Bought by
Crane Kevin M
Current Estimated Value
Home Financials for this Owner
Home Financials are based on the most recent Mortgage that was taken out on this home.
Original Mortgage
$138,750
Outstanding Balance
$123,411
Interest Rate
2.9%
Mortgage Type
New Conventional
Estimated Equity
$137,042
Purchase Details
Closed on
Sep 3, 2019
Sold by
Premo Edward and Premo Barbra
Bought by
Premo Edward A and Premo Barbra
Purchase Details
Closed on
Mar 5, 2004
Sold by
Obrien Bertrum D and Obrien Linda D
Bought by
Premo Edward and Premo Barbara
Purchase Details
Closed on
Oct 4, 1996
Sold by
Revocabl Short Beulah Humphrey and Revocabl Beulah Humphrey Short
Bought by
Froling Steven R and Froling Victoria L
Create a Home Valuation Report for This Property
The Home Valuation Report is an in-depth analysis detailing your home's value as well as a comparison with similar homes in the area
Home Values in the Area
Average Home Value in this Area
Purchase History
| Date | Buyer | Sale Price | Title Company |
|---|---|---|---|
| Crane Kevin M | $185,000 | First American Title | |
| Premo Edward A | -- | None Available | |
| Premo Edward | $111,000 | First American | |
| Froling Steven R | $45,000 | Jackson County Title |
Source: Public Records
Mortgage History
| Date | Status | Borrower | Loan Amount |
|---|---|---|---|
| Open | Crane Kevin M | $138,750 |
Source: Public Records
Tax History Compared to Growth
Tax History
| Year | Tax Paid | Tax Assessment Tax Assessment Total Assessment is a certain percentage of the fair market value that is determined by local assessors to be the total taxable value of land and additions on the property. | Land | Improvement |
|---|---|---|---|---|
| 2025 | $1,375 | $94,810 | $65,120 | $29,690 |
| 2024 | $1,375 | $92,050 | $63,230 | $28,820 |
| 2023 | $1,333 | $89,370 | $61,390 | $27,980 |
| 2022 | $1,300 | $89,370 | $61,390 | $27,980 |
| 2021 | $1,267 | $86,770 | $59,600 | $27,170 |
| 2020 | $1,240 | $84,250 | $57,860 | $26,390 |
| 2019 | $1,211 | $79,420 | $54,550 | $24,870 |
| 2018 | $1,180 | $77,110 | $52,960 | $24,150 |
| 2017 | $1,159 | $77,110 | $52,960 | $24,150 |
| 2016 | $1,166 | $72,690 | $49,920 | $22,770 |
| 2015 | $1,121 | $72,690 | $49,920 | $22,770 |
| 2014 | $1,096 | $68,530 | $47,060 | $21,470 |
Source: Public Records
Map
Nearby Homes