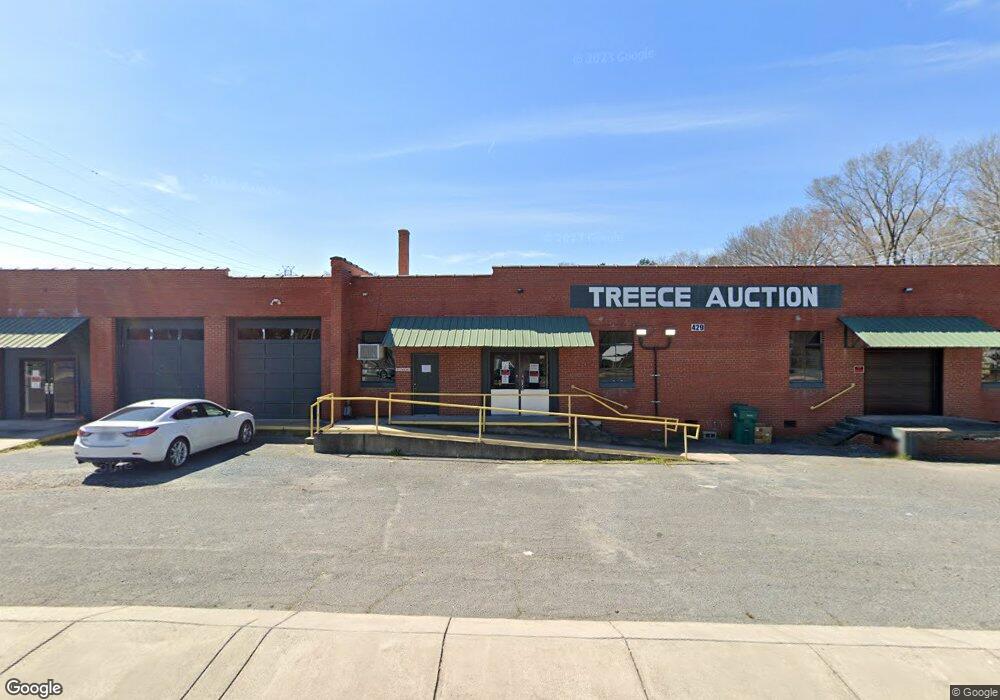
429 Salisbury Ave Albemarle, NC 28001
Estimated Value: $352,848
--
Bed
2
Baths
8,840
Sq Ft
$40/Sq Ft
Est. Value
About This Home
This home is located at 429 Salisbury Ave, Albemarle, NC 28001 and is currently estimated at $352,848, approximately $39 per square foot. 429 Salisbury Ave is a home located in Stanly County with nearby schools including Central Elementary School, Albemarle Middle School, and Albemarle High School.
Ownership History
Date
Name
Owned For
Owner Type
Purchase Details
Closed on
Sep 21, 2022
Sold by
Treece Tony A and Treece Angel T
Bought by
Twl Leasing And Management Co
Current Estimated Value
Home Financials for this Owner
Home Financials are based on the most recent Mortgage that was taken out on this home.
Original Mortgage
$255,000
Outstanding Balance
$231,486
Interest Rate
5.22%
Mortgage Type
New Conventional
Estimated Equity
$125,418
Purchase Details
Closed on
Aug 12, 2015
Sold by
Mullins Michael Anthony
Bought by
Nance Chucky L and Nance Jennifer R
Purchase Details
Closed on
Jan 1, 2012
Bought by
Mullins Michael Anthony
Purchase Details
Closed on
Feb 8, 2011
Sold by
Nance Chucky L and Nance Jennifer R
Bought by
Mullins Michael Anthony
Home Financials for this Owner
Home Financials are based on the most recent Mortgage that was taken out on this home.
Original Mortgage
$190,750
Interest Rate
4.82%
Mortgage Type
Seller Take Back
Create a Home Valuation Report for This Property
The Home Valuation Report is an in-depth analysis detailing your home's value as well as a comparison with similar homes in the area
Home Values in the Area
Average Home Value in this Area
Purchase History
| Date | Buyer | Sale Price | Title Company |
|---|---|---|---|
| Twl Leasing And Management Co | $300,000 | None Listed On Document | |
| Nance Chucky L | $119,500 | Attorney | |
| Mullins Michael Anthony | -- | -- | |
| Mullins Michael Anthony | $191,000 | None Available |
Source: Public Records
Mortgage History
| Date | Status | Borrower | Loan Amount |
|---|---|---|---|
| Open | Twl Leasing And Management Co | $255,000 | |
| Previous Owner | Mullins Michael Anthony | $190,750 |
Source: Public Records
Tax History Compared to Growth
Tax History
| Year | Tax Paid | Tax Assessment Tax Assessment Total Assessment is a certain percentage of the fair market value that is determined by local assessors to be the total taxable value of land and additions on the property. | Land | Improvement |
|---|---|---|---|---|
| 2025 | $3,070 | $274,095 | $38,527 | $235,568 |
| 2024 | $1,831 | $150,049 | $37,126 | $112,923 |
| 2023 | $1,831 | $150,049 | $37,126 | $112,923 |
| 2022 | $1,831 | $150,049 | $37,126 | $112,923 |
| 2021 | $1,831 | $150,049 | $37,126 | $112,923 |
| 2020 | $1,903 | $146,771 | $43,431 | $103,340 |
| 2019 | $1,923 | $146,771 | $43,431 | $103,340 |
| 2018 | $1,923 | $146,771 | $43,431 | $103,340 |
| 2017 | $1,849 | $146,771 | $43,431 | $103,340 |
| 2016 | $1,551 | $123,101 | $43,431 | $79,670 |
| 2015 | $1,567 | $123,101 | $43,431 | $79,670 |
| 2014 | $1,266 | $123,101 | $43,431 | $79,670 |
Source: Public Records
Map
Nearby Homes
- 610 Watts St
- 710 Austin St Unit 124
- 724 N 2nd St
- 10.02 Ash St
- 715 Wood St
- 218 Wilson St Unit A&B
- 1310 Ash St
- 1224 Hollywood Terrace
- 410 Moose St
- 408 Moose St
- 1240 Hollywood Terrace
- 1328 Columbus St
- 203 N Broome St
- 1119 Poplar St
- 406 Church St
- 507 N 5th St
- 1229 Wiscassett St
- 627 N 6th St
- 0 Pennington Rd Unit CAR4263058
- 1416 Salisbury Ave
- 430 Salisbury Ave
- 448 Corbin St
- 518 Salisbury Ave
- 507 Salisbury Ave
- 524 Salisbury Ave
- 507 W Mason St
- 511 W Mason St
- 441 W Oakwood Ave
- 530 Salisbury Ave
- 448 W Oakwood Ave
- 517 W Mason St
- 920 Marshall St
- 314 Leslie St
- 535 Salisbury Ave
- 536 Salisbury Ave
- 521 W Mason St
- 409 E Mason St
- 605 Salisbury Ave
- 503 W Oakwood Ave
- 506 W Oakwood Ave