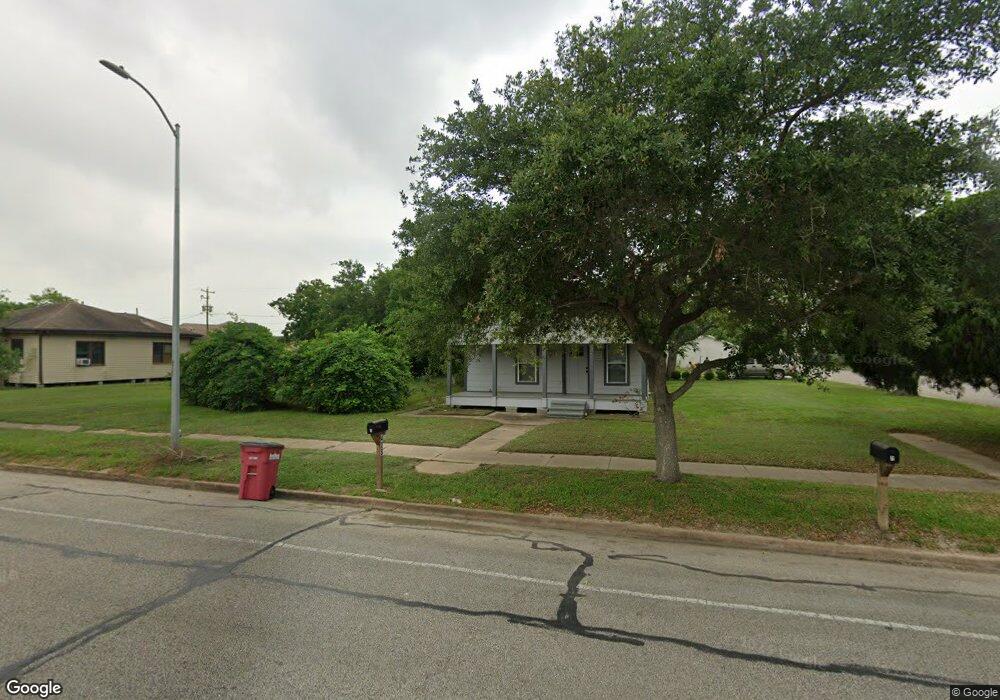
429 W 2nd St Unit 2 Freeport, TX 77541
Estimated Value: $171,949 - $209,000
1
Bed
1
Bath
1,248
Sq Ft
$151/Sq Ft
Est. Value
About This Home
This home is located at 429 W 2nd St Unit 2, Freeport, TX 77541 and is currently estimated at $188,487, approximately $151 per square foot. 429 W 2nd St Unit 2 is a home located in Brazoria County with nearby schools including O'Hara Lanier Middle School, Freeport Intermediate School, and Brazosport High School.
Ownership History
Date
Name
Owned For
Owner Type
Purchase Details
Closed on
Feb 23, 2017
Sold by
Leja Miguel
Bought by
Carreon Daniel
Current Estimated Value
Purchase Details
Closed on
Nov 7, 2008
Sold by
Leija Jose Abraham
Bought by
Leija Miguel
Purchase Details
Closed on
Oct 20, 2008
Sold by
Leija Bernardino and Leija Ignacio Lopez
Bought by
Leija Miguel
Purchase Details
Closed on
Apr 20, 1994
Sold by
Serna Tina
Bought by
Leija Ignacio Lopez and Leija Cerila
Create a Home Valuation Report for This Property
The Home Valuation Report is an in-depth analysis detailing your home's value as well as a comparison with similar homes in the area
Home Values in the Area
Average Home Value in this Area
Purchase History
| Date | Buyer | Sale Price | Title Company |
|---|---|---|---|
| Carreon Daniel | -- | None Available | |
| Leija Miguel | -- | None Available | |
| Leija Miguel | -- | None Available | |
| Leija Miguel | -- | None Available | |
| Leija Ignacio Lopez | -- | -- |
Source: Public Records
Tax History Compared to Growth
Tax History
| Year | Tax Paid | Tax Assessment Tax Assessment Total Assessment is a certain percentage of the fair market value that is determined by local assessors to be the total taxable value of land and additions on the property. | Land | Improvement |
|---|---|---|---|---|
| 2025 | $4,361 | $196,500 | $59,690 | $136,810 |
| 2023 | $4,361 | $226,340 | $74,610 | $151,730 |
| 2022 | $3,465 | $140,310 | $24,870 | $115,440 |
| 2021 | $3,143 | $120,610 | $10,660 | $109,950 |
| 2020 | $3,021 | $113,860 | $10,660 | $103,200 |
| 2019 | $2,304 | $84,290 | $10,660 | $73,630 |
| 2018 | $1,376 | $50,000 | $10,660 | $39,340 |
| 2017 | $1,379 | $50,000 | $10,660 | $39,340 |
| 2016 | $1,183 | $42,890 | $7,000 | $35,890 |
| 2014 | $734 | $38,860 | $7,000 | $31,860 |
Source: Public Records
Map
Nearby Homes