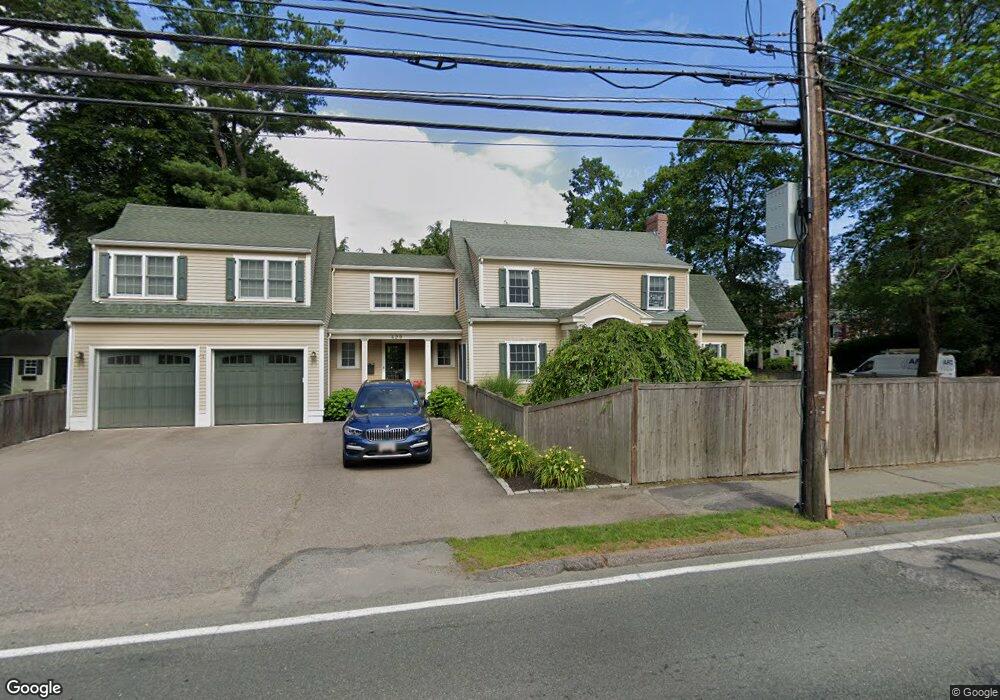
429 Weston Rd Wellesley, MA 02482
Estimated Value: $1,567,000 - $1,903,000
3
Beds
3
Baths
2,814
Sq Ft
$611/Sq Ft
Est. Value
About This Home
This home is located at 429 Weston Rd, Wellesley, MA 02482 and is currently estimated at $1,720,694, approximately $611 per square foot. 429 Weston Rd is a home located in Norfolk County with nearby schools including Katharine Lee Bates Elementary School, Wellesley Middle School, and Wellesley Sr High School.
Ownership History
Date
Name
Owned For
Owner Type
Purchase Details
Closed on
Apr 21, 1995
Sold by
Smith F Richard and Smith Lee C
Bought by
Buchler David A and Buchler Helene C
Current Estimated Value
Purchase Details
Closed on
Aug 18, 1993
Sold by
Orff Virgil C and Orff Doris A
Bought by
Smith F Richard and Smith Lee C
Create a Home Valuation Report for This Property
The Home Valuation Report is an in-depth analysis detailing your home's value as well as a comparison with similar homes in the area
Purchase History
| Date | Buyer | Sale Price | Title Company |
|---|---|---|---|
| Buchler David A | $288,000 | -- | |
| Smith F Richard | $252,000 | -- |
Source: Public Records
Mortgage History
| Date | Status | Borrower | Loan Amount |
|---|---|---|---|
| Open | Smith F Richard | $390,000 | |
| Closed | Smith F Richard | $223,000 | |
| Closed | Smith F Richard | $230,000 |
Source: Public Records
Tax History
| Year | Tax Paid | Tax Assessment Tax Assessment Total Assessment is a certain percentage of the fair market value that is determined by local assessors to be the total taxable value of land and additions on the property. | Land | Improvement |
|---|---|---|---|---|
| 2025 | $14,001 | $1,362,000 | $970,000 | $392,000 |
| 2024 | $12,752 | $1,225,000 | $844,000 | $381,000 |
| 2023 | $12,870 | $1,124,000 | $756,000 | $368,000 |
| 2022 | $11,925 | $1,021,000 | $648,000 | $373,000 |
| 2021 | $11,997 | $1,021,000 | $648,000 | $373,000 |
| 2020 | $11,803 | $1,021,000 | $648,000 | $373,000 |
| 2019 | $11,813 | $1,021,000 | $648,000 | $373,000 |
| 2018 | $11,807 | $988,000 | $628,000 | $360,000 |
| 2017 | $11,649 | $988,000 | $628,000 | $360,000 |
| 2016 | $11,428 | $966,000 | $618,000 | $348,000 |
| 2015 | $10,589 | $916,000 | $585,000 | $331,000 |
Source: Public Records
Map
Nearby Homes