Estimated Value: $141,000 - $179,000
4
Beds
5
Baths
3,310
Sq Ft
$49/Sq Ft
Est. Value
About This Home
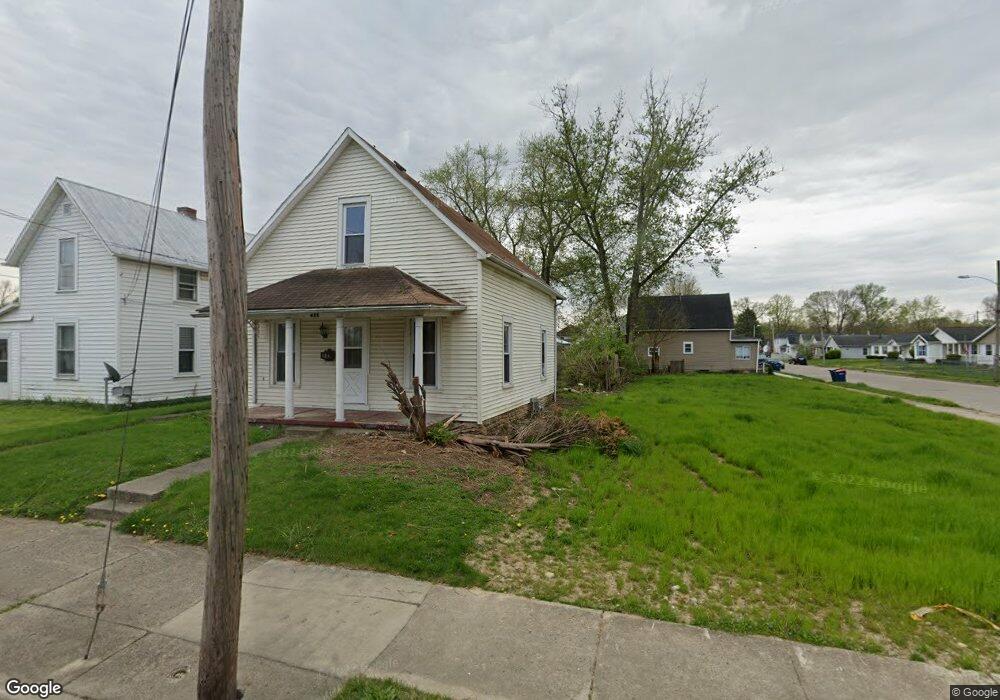
This home is located at 429 Young St, Piqua, OH 45356 and is currently estimated at $161,214, approximately $48 per square foot. 429 Young St is a home located in Miami County with nearby schools including Piqua Junior High School, Piqua High School, and Nicholas School.
Ownership History
Date
Name
Owned For
Owner Type
Purchase Details
Closed on
Dec 20, 2023
Sold by
Wackler Jason D
Bought by
429 Young Street Llc
Current Estimated Value
Purchase Details
Closed on
Jan 27, 2005
Sold by
Robinaugh Robert J and Robinaugh Julia E
Bought by
Wackler Jason D
Home Financials for this Owner
Home Financials are based on the most recent Mortgage that was taken out on this home.
Original Mortgage
$72,000
Interest Rate
5.77%
Mortgage Type
New Conventional
Purchase Details
Closed on
Feb 15, 1990
Bought by
Robinaugh Robert J
Create a Home Valuation Report for This Property
The Home Valuation Report is an in-depth analysis detailing your home's value as well as a comparison with similar homes in the area
Home Values in the Area
Average Home Value in this Area
Purchase History
| Date | Buyer | Sale Price | Title Company |
|---|---|---|---|
| 429 Young Street Llc | -- | None Listed On Document | |
| Wackler Jason D | $90,000 | -- | |
| Robinaugh Robert J | $55,000 | -- |
Source: Public Records
Mortgage History
| Date | Status | Borrower | Loan Amount |
|---|---|---|---|
| Previous Owner | Wackler Jason D | $72,000 |
Source: Public Records
Tax History
| Year | Tax Paid | Tax Assessment Tax Assessment Total Assessment is a certain percentage of the fair market value that is determined by local assessors to be the total taxable value of land and additions on the property. | Land | Improvement |
|---|---|---|---|---|
| 2025 | $1,535 | $5,110 | $5,110 | $0 |
| 2024 | $1,535 | $5,710 | $5,710 | $0 |
| 2023 | $951 | $5,710 | $5,710 | $0 |
| 2022 | $19,401 | $5,710 | $5,710 | $0 |
| 2021 | $761 | $16,280 | $4,240 | $12,040 |
| 2020 | $898 | $16,280 | $4,240 | $12,040 |
| 2019 | $1,007 | $16,280 | $4,240 | $12,040 |
| 2018 | $2,645 | $14,700 | $4,270 | $10,430 |
| 2017 | $3,411 | $14,700 | $4,270 | $10,430 |
| 2016 | $2,571 | $14,700 | $4,270 | $10,430 |
| 2015 | $1,551 | $14,150 | $4,100 | $10,050 |
| 2014 | $1,551 | $14,150 | $4,100 | $10,050 |
| 2013 | $1,429 | $14,150 | $4,100 | $10,050 |
Source: Public Records
Map
Nearby Homes
Your Personal Tour Guide
Ask me questions while you tour the home.