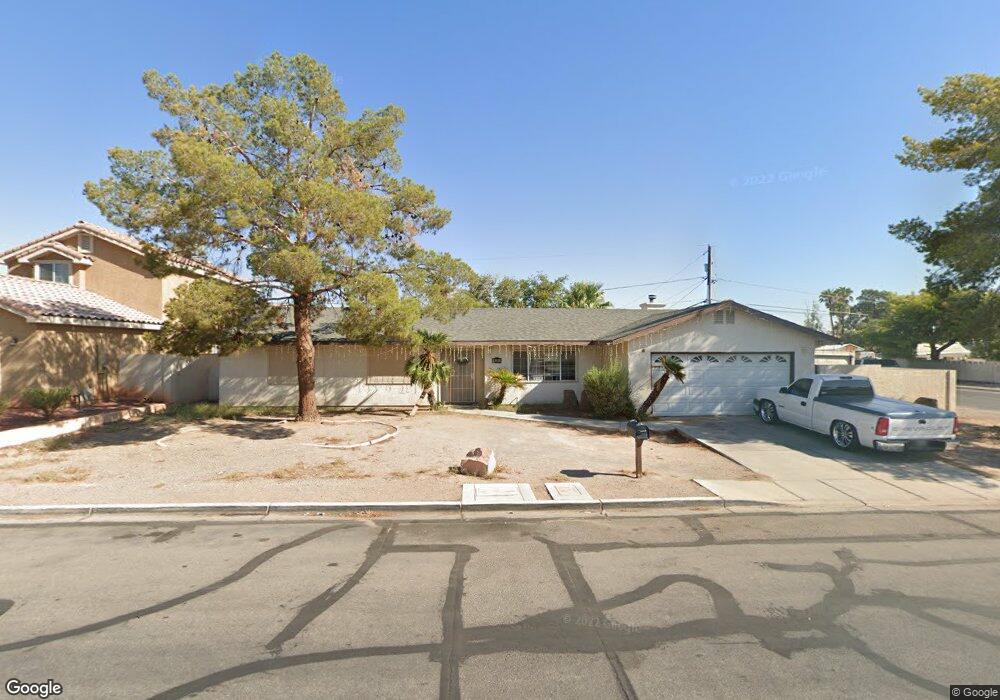
4290 E Cincinnati Ave Las Vegas, NV 89104
Estimated Value: $352,000 - $438,000
3
Beds
2
Baths
1,571
Sq Ft
$245/Sq Ft
Est. Value
About This Home
This home is located at 4290 E Cincinnati Ave, Las Vegas, NV 89104 and is currently estimated at $384,174, approximately $244 per square foot. 4290 E Cincinnati Ave is a home located in Clark County with nearby schools including William E. Snyder Elementary School, Jerome Mack Middle School, and Chaparral High School.
Ownership History
Date
Name
Owned For
Owner Type
Purchase Details
Closed on
Mar 21, 2014
Sold by
Sar Hour and Sar Samphoun
Bought by
Hour & Sam Investment Llc
Current Estimated Value
Purchase Details
Closed on
Nov 10, 2009
Sold by
Citibank National Association
Bought by
Sar Hour and Sar Samphoun
Purchase Details
Closed on
Sep 2, 2009
Sold by
Townsend Majure and Townsend Leonora
Bought by
Citibank National Association
Purchase Details
Closed on
May 19, 1995
Sold by
Hernandez Juan O and Hernandez Micaela
Bought by
Townsend Majure and Townsend Leonora
Home Financials for this Owner
Home Financials are based on the most recent Mortgage that was taken out on this home.
Original Mortgage
$94,000
Interest Rate
8.32%
Mortgage Type
Seller Take Back
Purchase Details
Closed on
Nov 4, 1993
Sold by
Verdugo Frederick P and Verdugo Ellis J
Bought by
Hernandez Olivia
Home Financials for this Owner
Home Financials are based on the most recent Mortgage that was taken out on this home.
Original Mortgage
$13,500
Interest Rate
6.97%
Mortgage Type
Seller Take Back
Create a Home Valuation Report for This Property
The Home Valuation Report is an in-depth analysis detailing your home's value as well as a comparison with similar homes in the area
Home Values in the Area
Average Home Value in this Area
Purchase History
| Date | Buyer | Sale Price | Title Company |
|---|---|---|---|
| Hour & Sam Investment Llc | -- | None Available | |
| Sar Hour | $75,000 | Fidelity Rainbow | |
| Citibank National Association | $69,427 | Accommodation | |
| Townsend Majure | $114,000 | Land Title | |
| Hernandez Olivia | $30,000 | Land Title |
Source: Public Records
Mortgage History
| Date | Status | Borrower | Loan Amount |
|---|---|---|---|
| Previous Owner | Townsend Majure | $94,000 | |
| Previous Owner | Hernandez Olivia | $13,500 |
Source: Public Records
Tax History Compared to Growth
Tax History
| Year | Tax Paid | Tax Assessment Tax Assessment Total Assessment is a certain percentage of the fair market value that is determined by local assessors to be the total taxable value of land and additions on the property. | Land | Improvement |
|---|---|---|---|---|
| 2025 | $1,475 | $79,231 | $28,875 | $50,356 |
| 2024 | $1,366 | $79,231 | $28,875 | $50,356 |
| 2023 | $1,366 | $80,496 | $32,725 | $47,771 |
| 2022 | $1,265 | $70,888 | $26,950 | $43,938 |
| 2021 | $1,172 | $65,065 | $23,100 | $41,965 |
| 2020 | $1,085 | $64,577 | $22,715 | $41,862 |
| 2019 | $1,017 | $62,562 | $21,175 | $41,387 |
| 2018 | $970 | $55,905 | $15,925 | $39,980 |
| 2017 | $1,657 | $56,484 | $15,925 | $40,559 |
| 2016 | $909 | $51,536 | $10,395 | $41,141 |
| 2015 | $908 | $40,080 | $8,470 | $31,610 |
| 2014 | $880 | $31,297 | $7,700 | $23,597 |
Source: Public Records
Map
Nearby Homes
- 2278 Miner Way
- 4214 E Baltimore Ave
- 4120 E Cincinnati Ave
- 4170 E Baltimore Ave
- 4410 E Boston Ave
- 4324 E Saint Louis Ave
- 4510 E Cleveland Ave
- 4555 E Sahara Ave Unit 276
- 4555 E Sahara Ave Unit 280
- 4555 E Sahara Ave Unit 288
- 4555 E Sahara Ave Unit 252
- 4555 E Sahara Ave Unit 226
- 4555 E Sahara Ave Unit 231
- 2356 Grannis Ln
- 1892 Miner Way
- 2800 S Lamb Blvd Unit 40
- 2800 S Lamb Blvd Unit 155
- 2800 S Lamb Blvd Unit 154
- 4590 E Saint Louis Ave
- 4055 E New York Ave
- 4282 E Cincinnati Ave
- 4291 Welter Ave
- 4263 Welter Ave
- 4312 E Cincinnati Ave
- 4266 E Cincinnati Ave
- 4315 Welter Ave
- 4257 Welter Ave
- 4286 Welter Ave
- 4324 E Cincinnati Ave
- 4270 Welter Ave
- 4325 Welter Ave
- 4310 Welter Ave
- 4254 Welter Ave
- 4291 E Cleveland Ave
- 4320 Welter Ave
- 4342 E Cincinnati Ave
- 4271 E Cleveland Ave
- 4343 Welter Ave
- 4230 Welter Ave
- 4311 E Cleveland Ave