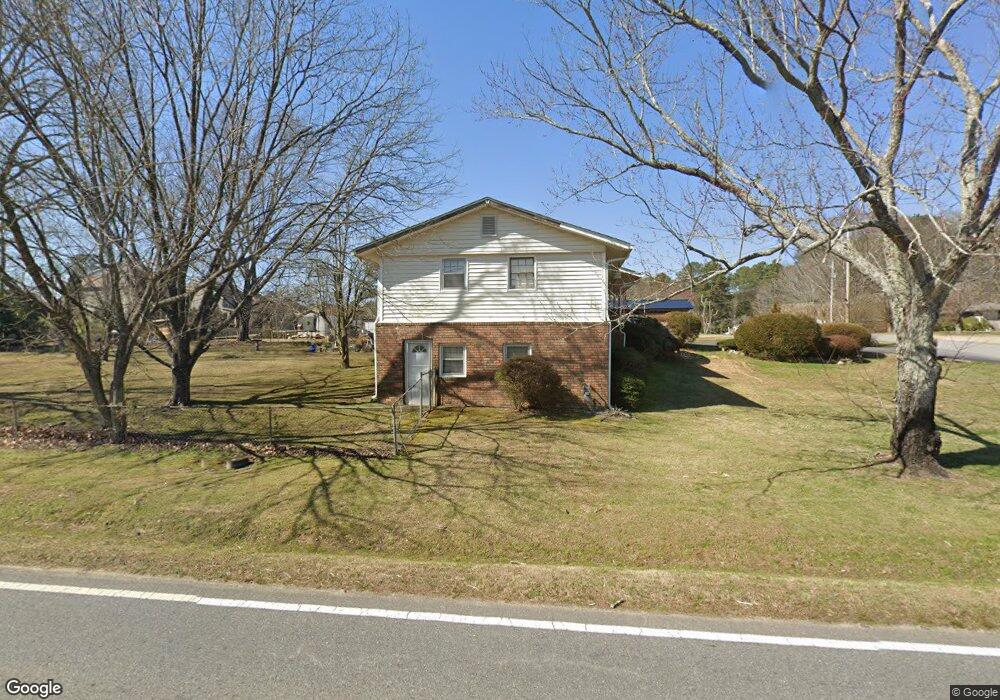
4290 Shiloh Dr Cumming, GA 30040
Estimated Value: $331,000 - $609,000
3
Beds
3
Baths
1,650
Sq Ft
$277/Sq Ft
Est. Value
About This Home
This home is located at 4290 Shiloh Dr, Cumming, GA 30040 and is currently estimated at $457,093, approximately $277 per square foot. 4290 Shiloh Dr is a home located in Forsyth County with nearby schools including DeSana Middle School, Denmark High School, and Alpharetta Tamil School.
Ownership History
Date
Name
Owned For
Owner Type
Purchase Details
Closed on
Nov 10, 2016
Sold by
Wendy
Bought by
Coppola Nicole A and Francis Bobby L
Current Estimated Value
Purchase Details
Closed on
Oct 27, 2016
Sold by
Phair Christopher
Bought by
Henry Wendy
Purchase Details
Closed on
Mar 20, 2012
Sold by
Henry Wendy
Bought by
Phair Henry Wendy and Phair Henry Christopher
Purchase Details
Closed on
May 22, 2007
Sold by
Wells Fargo Financial Bank
Bought by
Porter Thomas D and Porter Naomi D A
Purchase Details
Closed on
Oct 25, 2004
Sold by
Mangham Orris L and Mangham Carrie
Bought by
Lackey R G
Purchase Details
Closed on
Dec 27, 1993
Sold by
Brown Vernon N and Brown Frankie
Bought by
Mangham Orris and Mangham Carrie
Home Financials for this Owner
Home Financials are based on the most recent Mortgage that was taken out on this home.
Original Mortgage
$84,666
Interest Rate
7.25%
Create a Home Valuation Report for This Property
The Home Valuation Report is an in-depth analysis detailing your home's value as well as a comparison with similar homes in the area
Home Values in the Area
Average Home Value in this Area
Purchase History
| Date | Buyer | Sale Price | Title Company |
|---|---|---|---|
| Coppola Nicole A | $249,900 | -- | |
| Henry Wendy | -- | -- | |
| Phair Henry Wendy | -- | -- | |
| Henry Wendy | $215,000 | -- | |
| Porter Thomas D | -- | -- | |
| Lackey R G | $105,000 | -- | |
| Mangham Orris | $86,000 | -- |
Source: Public Records
Mortgage History
| Date | Status | Borrower | Loan Amount |
|---|---|---|---|
| Previous Owner | Mangham Orris | $84,666 |
Source: Public Records
Tax History Compared to Growth
Tax History
| Year | Tax Paid | Tax Assessment Tax Assessment Total Assessment is a certain percentage of the fair market value that is determined by local assessors to be the total taxable value of land and additions on the property. | Land | Improvement |
|---|---|---|---|---|
| 2025 | $3,391 | $148,696 | $48,000 | $100,696 |
| 2024 | $3,391 | $138,304 | $40,000 | $98,304 |
| 2023 | $3,014 | $122,464 | $32,000 | $90,464 |
| 2022 | $2,496 | $89,124 | $24,800 | $64,324 |
| 2021 | $2,461 | $89,124 | $24,800 | $64,324 |
| 2020 | $2,351 | $85,152 | $24,000 | $61,152 |
| 2019 | $2,349 | $84,940 | $24,000 | $60,940 |
| 2018 | $1,894 | $68,492 | $24,000 | $44,492 |
| 2017 | $1,708 | $61,552 | $20,000 | $41,552 |
| 2016 | $1,597 | $57,552 | $16,000 | $41,552 |
| 2015 | $1,600 | $57,552 | $16,000 | $41,552 |
| 2014 | $1,447 | $54,656 | $0 | $0 |
Source: Public Records
Map
Nearby Homes
- 4415 Natchez Ln
- 4510 Muskogee Ct
- 4525 Muskogee Ct
- 4420 Natchez Ln
- 4555 Natchez Ln
- 4333 Shiloh Rd
- 4770 Shiloh Springs Rd
- 687 Summit Crossing Way
- 4735 Shiloh Valley Rd
- 3860 Oxford Park Ln
- 7235 Stoller Dr
- 7130 Winderlea Ln
- 4050 Bryton Trace Dr
- 4875 Shiloh Crossing Way
- 7270 Stoller Dr
- 3910 Redwood Dr
- 4905 Shiloh Crossing Way
- 7330 Stoller Dr
- Redford Plan at Courtyards at Traditions
- 4280 Shiloh Dr
- 4270 Shiloh Dr
- 0 Shiloh Dr Unit 8825026
- 0 Shiloh Dr Unit 8089111
- 0 Shiloh Dr
- 4735 Fallow Ln
- 4285 Shiloh Dr
- 4745 Fallow Ln
- 4275 Shiloh Dr
- 4260 Shiloh Dr
- 4403 Shiloh Rd
- 4725 Fallow Ln
- 4265 Shiloh Dr
- 4750 Fallow Ln
- 4715 Fallow Ln
- 4250 Shiloh Dr
- 4255 Shiloh Dr
- 4705 Fallow Ln
- 4740 Fallow Ln
- 4730 Fallow Ln