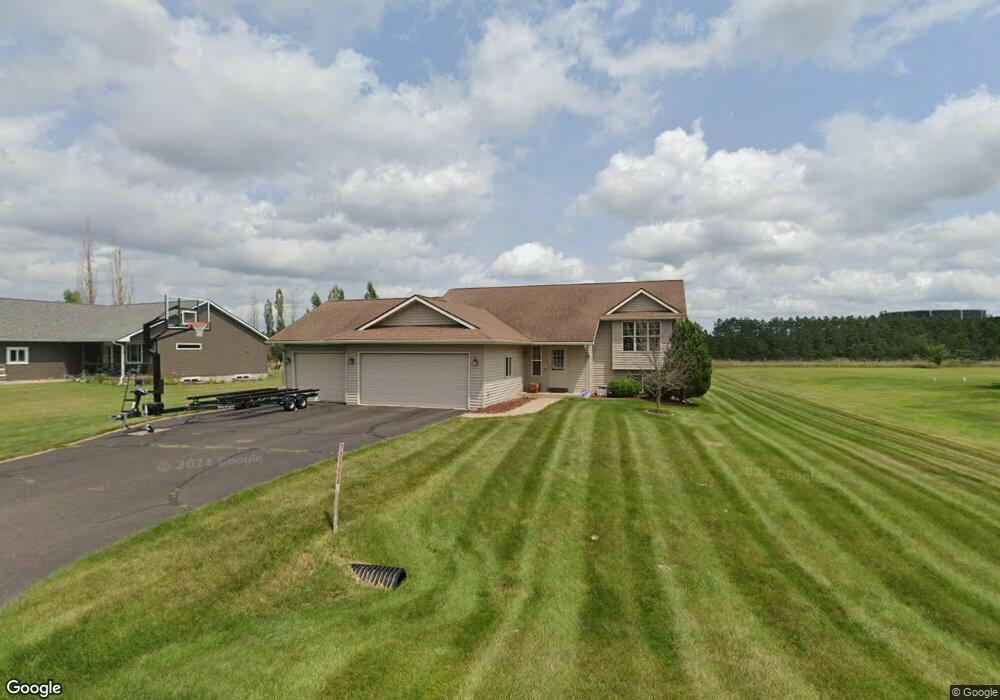
4293 119th St Chippewa Falls, WI 54729
Estimated Value: $374,467 - $401,000
2
Beds
2
Baths
1,660
Sq Ft
$232/Sq Ft
Est. Value
About This Home
This home is located at 4293 119th St, Chippewa Falls, WI 54729 and is currently estimated at $385,367, approximately $232 per square foot. 4293 119th St is a home located in Chippewa County with nearby schools including Southview Elementary School, Chippewa Falls Middle School, and Chippewa Falls High School.
Ownership History
Date
Name
Owned For
Owner Type
Purchase Details
Closed on
Aug 14, 2009
Sold by
Teuteberg Robert N
Bought by
Hoyle David J and Hoyle Stephanie J
Current Estimated Value
Home Financials for this Owner
Home Financials are based on the most recent Mortgage that was taken out on this home.
Original Mortgage
$164,367
Outstanding Balance
$107,605
Interest Rate
5.29%
Mortgage Type
FHA
Estimated Equity
$277,762
Purchase Details
Closed on
Dec 27, 2006
Sold by
Teuteberg Katie A
Bought by
Teuteberg Robert N
Purchase Details
Closed on
Jun 30, 2006
Sold by
Lyberg Dennis C and Lyberg Dennis
Bought by
Teuteberg Robert N and Teuteberg Katie A
Home Financials for this Owner
Home Financials are based on the most recent Mortgage that was taken out on this home.
Original Mortgage
$120,000
Interest Rate
6.72%
Mortgage Type
New Conventional
Purchase Details
Closed on
Apr 26, 2006
Sold by
Hager Robert F and Hager Maxine G
Bought by
Lyberg Dennis
Create a Home Valuation Report for This Property
The Home Valuation Report is an in-depth analysis detailing your home's value as well as a comparison with similar homes in the area
Home Values in the Area
Average Home Value in this Area
Purchase History
| Date | Buyer | Sale Price | Title Company |
|---|---|---|---|
| Hoyle David J | $167,400 | None Available | |
| Teuteberg Robert N | $154,000 | -- | |
| Teuteberg Robert N | $150,000 | None Available | |
| Lyberg Dennis | $31,800 | Chippewa County Abstract & T |
Source: Public Records
Mortgage History
| Date | Status | Borrower | Loan Amount |
|---|---|---|---|
| Open | Hoyle David J | $164,367 | |
| Previous Owner | Teuteberg Robert N | $120,000 |
Source: Public Records
Tax History Compared to Growth
Tax History
| Year | Tax Paid | Tax Assessment Tax Assessment Total Assessment is a certain percentage of the fair market value that is determined by local assessors to be the total taxable value of land and additions on the property. | Land | Improvement |
|---|---|---|---|---|
| 2024 | $3,411 | $226,000 | $26,000 | $200,000 |
| 2023 | $3,315 | $226,000 | $26,000 | $200,000 |
| 2022 | $3,269 | $226,000 | $26,000 | $200,000 |
| 2021 | $3,349 | $226,000 | $26,000 | $200,000 |
| 2020 | $3,461 | $226,000 | $26,000 | $200,000 |
| 2019 | $3,397 | $226,000 | $26,000 | $200,000 |
| 2018 | $2,978 | $166,000 | $20,000 | $146,000 |
| 2017 | $2,820 | $166,000 | $20,000 | $146,000 |
| 2016 | $2,922 | $166,000 | $20,000 | $146,000 |
| 2015 | $2,884 | $166,000 | $20,000 | $146,000 |
| 2014 | $2,850 | $166,000 | $20,000 | $146,000 |
Source: Public Records
Map
Nearby Homes
- Lot 50 114th St
- Lot 45 114th St
- Lot 46 114th St
- Lot 51 114th St
- Lot 61 114th St
- Lot 60 114th St
- Lot 48 114th St
- VL 20 125th St
- 11340 45th Ave
- 11354 39th Ave
- Lot 8 112th St
- Lot 28 112th St
- Lot 29 112th St
- Lot 2 112th St
- Lot 7 112th St
- Lot 10 112th St
- Lot 15 112th St
- Lot 27 112th St
- Lot 1 112th St
- Lot 14 112th St