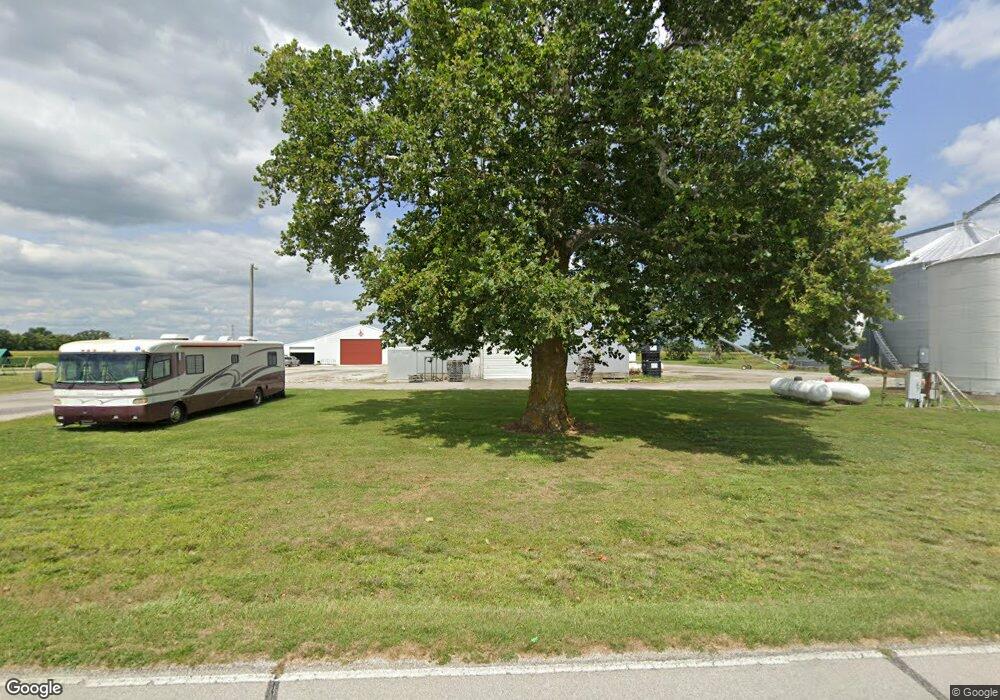
4294 E 300 N Greenfield, IN 46140
Estimated Value: $652,000 - $845,016
4
Beds
2
Baths
3,483
Sq Ft
$215/Sq Ft
Est. Value
About This Home
This home is located at 4294 E 300 N, Greenfield, IN 46140 and is currently estimated at $748,508, approximately $214 per square foot. 4294 E 300 N is a home located in Hancock County with nearby schools including Maxwell Intermediate School, Eden Elementary School, and Greenfield Central Junior High School.
Ownership History
Date
Name
Owned For
Owner Type
Purchase Details
Closed on
Nov 5, 2020
Sold by
Cole John Ronald
Bought by
Cole Connie J and John Ronald Cole Family Revoca
Current Estimated Value
Purchase Details
Closed on
May 16, 2011
Sold by
Cole Philmia
Bought by
Cole John Ronald
Home Financials for this Owner
Home Financials are based on the most recent Mortgage that was taken out on this home.
Original Mortgage
$70,000
Outstanding Balance
$48,467
Interest Rate
4.8%
Mortgage Type
Purchase Money Mortgage
Estimated Equity
$700,041
Purchase Details
Closed on
May 12, 2011
Sold by
John & Doris Cole Farms Inc
Bought by
Cole John Ronald
Home Financials for this Owner
Home Financials are based on the most recent Mortgage that was taken out on this home.
Original Mortgage
$70,000
Outstanding Balance
$48,467
Interest Rate
4.8%
Mortgage Type
Purchase Money Mortgage
Estimated Equity
$700,041
Create a Home Valuation Report for This Property
The Home Valuation Report is an in-depth analysis detailing your home's value as well as a comparison with similar homes in the area
Purchase History
| Date | Buyer | Sale Price | Title Company |
|---|---|---|---|
| Cole Connie J | -- | None Available | |
| Cole John Ronald | -- | -- | |
| Cole John Ronald | -- | -- |
Source: Public Records
Mortgage History
| Date | Status | Borrower | Loan Amount |
|---|---|---|---|
| Open | Cole John Ronald | $70,000 |
Source: Public Records
Tax History
| Year | Tax Paid | Tax Assessment Tax Assessment Total Assessment is a certain percentage of the fair market value that is determined by local assessors to be the total taxable value of land and additions on the property. | Land | Improvement |
|---|---|---|---|---|
| 2024 | $7,130 | $657,900 | $90,900 | $567,000 |
| 2023 | $7,175 | $635,100 | $100,000 | $535,100 |
| 2022 | $6,020 | $548,200 | $59,300 | $488,900 |
| 2021 | $4,972 | $447,600 | $56,600 | $391,000 |
| 2020 | $4,987 | $435,400 | $56,500 | $378,900 |
| 2019 | $4,982 | $430,200 | $60,000 | $370,200 |
| 2018 | $5,115 | $433,600 | $60,600 | $373,000 |
| 2017 | $5,490 | $441,000 | $63,700 | $377,300 |
| 2016 | $5,922 | $431,100 | $64,800 | $366,300 |
| 2014 | $5,798 | $434,100 | $64,900 | $369,200 |
| 2013 | $5,798 | $438,800 | $61,200 | $377,600 |
Source: Public Records
Map
Nearby Homes
- 1380 Fairmount Dr
- 1751 Moss Landing Ln
- 1727 Moss Landing Ln
- 2339 Dillon Dr
- 2404 Dillon Dr
- 1640 Colorado Spruce Way
- 2320 Dillon Dr
- 3513 N 300 E
- 2403 Fir Dr
- 1636 Hemlock Cir
- 2345 Fir Dr
- 2054 Frost Line Ln
- 2065 Frost Line Ln
- 2331 Fir Dr
- 1624 Hemlock Cir
- 2053 Frost Line Ln
- 2420 Fir Dr
- 2220 Foothill Dr
- 2041 Frost Line Ln
- 2412 Fir Dr