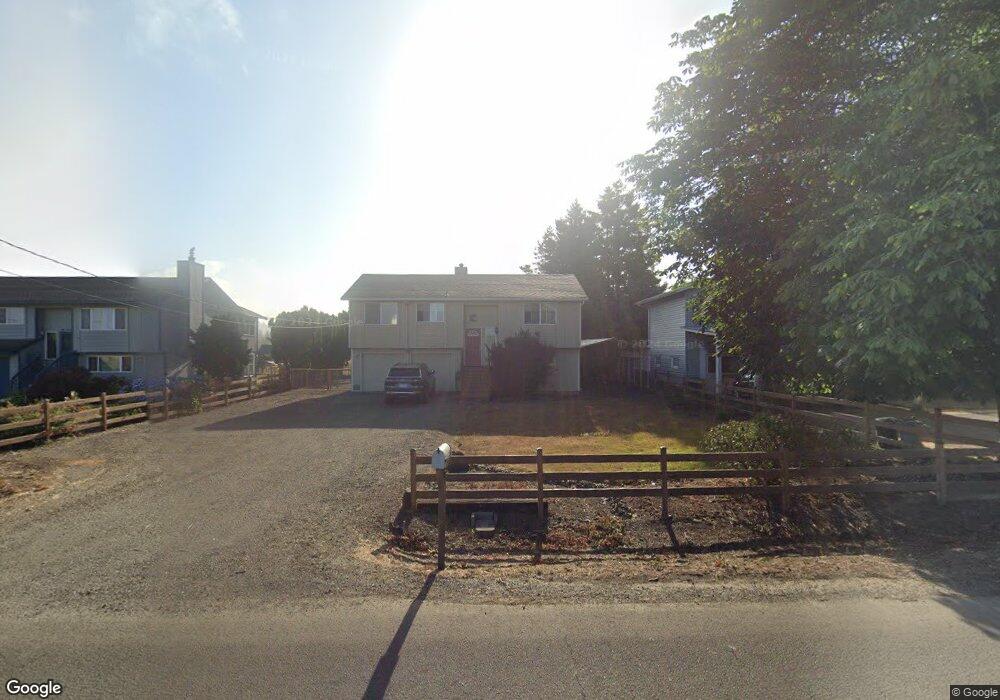
4295 Brickyard Rd Tillamook, OR 97141
Estimated Value: $416,000 - $554,000
3
Beds
2
Baths
1,074
Sq Ft
$433/Sq Ft
Est. Value
About This Home
This home is located at 4295 Brickyard Rd, Tillamook, OR 97141 and is currently estimated at $465,411, approximately $433 per square foot. 4295 Brickyard Rd is a home located in Tillamook County with nearby schools including Tillamook High School, Little Clipper Preschool, and Hendrickson Academy.
Ownership History
Date
Name
Owned For
Owner Type
Purchase Details
Closed on
Nov 30, 2012
Sold by
Abel Patrick and Bernard Kathy
Bought by
Abel Patrick
Current Estimated Value
Home Financials for this Owner
Home Financials are based on the most recent Mortgage that was taken out on this home.
Original Mortgage
$194,500
Outstanding Balance
$134,693
Interest Rate
3.36%
Mortgage Type
New Conventional
Estimated Equity
$330,718
Purchase Details
Closed on
Mar 22, 2007
Sold by
Melberg Jeff and Cole Barry
Bought by
Abel Patrick and Bernard Kathy
Home Financials for this Owner
Home Financials are based on the most recent Mortgage that was taken out on this home.
Original Mortgage
$205,000
Interest Rate
6.29%
Mortgage Type
New Conventional
Purchase Details
Closed on
Sep 15, 2006
Sold by
Markee Jerry Lee and Markee Sandi J
Bought by
Melberg Jeff and Cole Barry
Create a Home Valuation Report for This Property
The Home Valuation Report is an in-depth analysis detailing your home's value as well as a comparison with similar homes in the area
Home Values in the Area
Average Home Value in this Area
Purchase History
| Date | Buyer | Sale Price | Title Company |
|---|---|---|---|
| Abel Patrick | -- | None Available | |
| Abel Patrick | $273,000 | Fidelity Natl Title Co Of Or | |
| Melberg Jeff | $130,000 | Ticor Title |
Source: Public Records
Mortgage History
| Date | Status | Borrower | Loan Amount |
|---|---|---|---|
| Open | Abel Patrick | $194,500 | |
| Closed | Abel Patrick | $205,000 |
Source: Public Records
Tax History Compared to Growth
Tax History
| Year | Tax Paid | Tax Assessment Tax Assessment Total Assessment is a certain percentage of the fair market value that is determined by local assessors to be the total taxable value of land and additions on the property. | Land | Improvement |
|---|---|---|---|---|
| 2024 | $1,967 | $197,260 | $61,410 | $135,850 |
| 2023 | $1,956 | $191,520 | $59,620 | $131,900 |
| 2022 | $1,887 | $185,950 | $57,880 | $128,070 |
| 2021 | $1,831 | $180,540 | $56,190 | $124,350 |
| 2020 | $1,782 | $175,290 | $54,550 | $120,740 |
| 2019 | $1,738 | $170,190 | $52,960 | $117,230 |
| 2018 | $1,694 | $165,240 | $51,420 | $113,820 |
| 2017 | $1,652 | $160,430 | $49,920 | $110,510 |
| 2016 | $1,588 | $155,760 | $48,470 | $107,290 |
| 2015 | $1,558 | $151,230 | $47,060 | $104,170 |
| 2014 | $1,535 | $146,830 | $45,690 | $101,140 |
| 2013 | -- | $142,560 | $44,360 | $98,200 |
Source: Public Records
Map
Nearby Homes
- 9225 Millcreek Rd
- 9225 Mill Creek Rd
- 9065 Trask River Rd
- 0 Valley View Dr Unit 24275744
- 0 Edelwyss Rd Unit TL 405 25-357
- 0 Edelwyss Rd Unit 405 731536279
- 1690 Skyline Dr
- 7400 S Prairie Rd
- 10360 Skyview Rd
- 810 Marvin Rd
- 0 Skyview Rd Unit 41 424877504
- 0 Skyview Rd Unit 410604 427457611
- 5305 Kenway Dr
- 650 Marvin Rd
- V/L Marolf Loop Rd
- 4205 Ginkgo Ave
- 1110 Meadow Ave
- 4004 Ginkgo Ave
- 8675 Fairview Rd
- 4004 Elmwood St
- 4255 Brickyard Rd
- 4205 Brickyard Rd
- 4175 Brickyard Rd
- 4365 Brickyard Rd
- 4125 Brickyard Rd
- 4095 Brickyard Rd
- 8055 Long Prairie Rd
- 4075 Brickyard Rd
- 4445 Brickyard Rd
- 7285 Long Prairie Rd
- 7285 Long Prairie Rd
- 4055 Brickyard Rd
- 4455 Brickyard Rd
- 8085 Long Prairie Rd
- 4025 Brickyard Rd
- 4485 Brickyard Rd
- 8025 Long Prairie Rd
- 8075 Long Prairie Rd
- 7970 Long Prairie Rd
- 7910 Long Prairie Rd