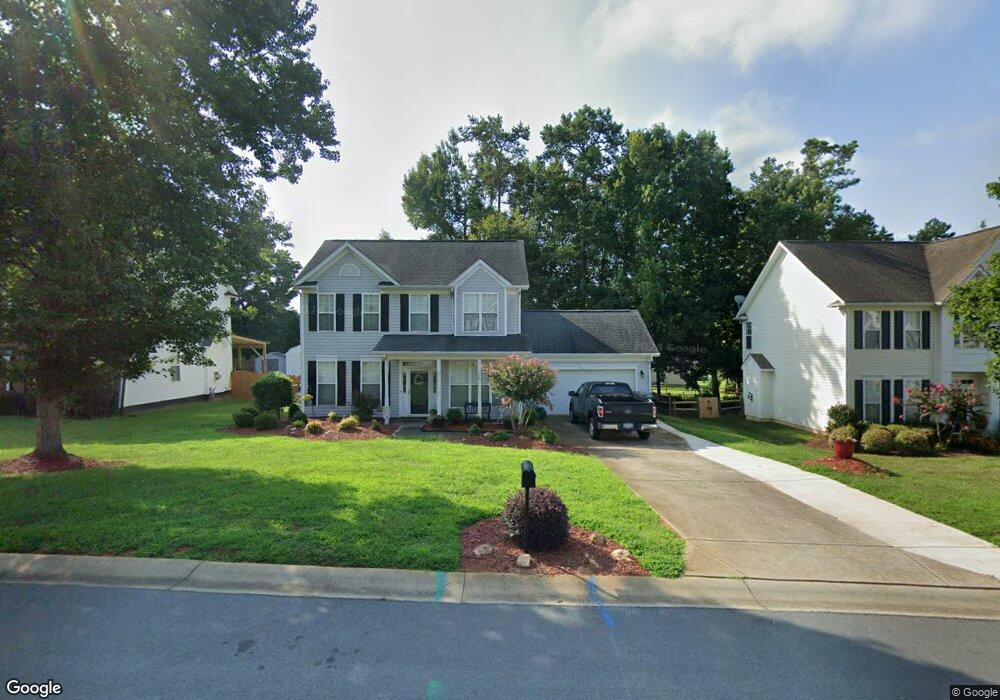
4295 Kiser Woods Dr SW Concord, NC 28025
Estimated Value: $339,000 - $404,000
3
Beds
3
Baths
1,746
Sq Ft
$214/Sq Ft
Est. Value
About This Home
This home is located at 4295 Kiser Woods Dr SW, Concord, NC 28025 and is currently estimated at $373,717, approximately $214 per square foot. 4295 Kiser Woods Dr SW is a home located in Cabarrus County with nearby schools including Rocky River Elementary School, J.N. Fries Middle School, and Branch Christian Academy.
Ownership History
Date
Name
Owned For
Owner Type
Purchase Details
Closed on
May 21, 2013
Sold by
Plummer Rusell Kent and Plummer Erin Dalton
Bought by
Granger Johnny J and Granger Laurel J
Current Estimated Value
Home Financials for this Owner
Home Financials are based on the most recent Mortgage that was taken out on this home.
Original Mortgage
$147,000
Outstanding Balance
$107,687
Interest Rate
4.25%
Mortgage Type
Adjustable Rate Mortgage/ARM
Estimated Equity
$266,030
Purchase Details
Closed on
Aug 30, 2000
Sold by
Cherry Homes Inc
Bought by
Plummer Russell Kent and Plummer Erin Dalton
Home Financials for this Owner
Home Financials are based on the most recent Mortgage that was taken out on this home.
Original Mortgage
$137,342
Interest Rate
8.24%
Mortgage Type
FHA
Purchase Details
Closed on
Nov 1, 1996
Bought by
B W Homes Inc
Create a Home Valuation Report for This Property
The Home Valuation Report is an in-depth analysis detailing your home's value as well as a comparison with similar homes in the area
Home Values in the Area
Average Home Value in this Area
Purchase History
| Date | Buyer | Sale Price | Title Company |
|---|---|---|---|
| Granger Johnny J | $148,000 | None Available | |
| Plummer Russell Kent | $138,500 | -- | |
| B W Homes Inc | -- | -- |
Source: Public Records
Mortgage History
| Date | Status | Borrower | Loan Amount |
|---|---|---|---|
| Open | Granger Johnny J | $147,000 | |
| Previous Owner | Plummer Russell Kent | $137,342 |
Source: Public Records
Tax History
| Year | Tax Paid | Tax Assessment Tax Assessment Total Assessment is a certain percentage of the fair market value that is determined by local assessors to be the total taxable value of land and additions on the property. | Land | Improvement |
|---|---|---|---|---|
| 2025 | $3,064 | $307,610 | $80,000 | $227,610 |
| 2024 | $3,064 | $307,610 | $80,000 | $227,610 |
| 2023 | $2,286 | $187,400 | $41,000 | $146,400 |
| 2022 | $2,216 | $181,660 | $41,000 | $140,660 |
| 2021 | $2,216 | $181,660 | $41,000 | $140,660 |
| 2020 | $2,216 | $181,660 | $41,000 | $140,660 |
| 2019 | $1,814 | $148,680 | $25,000 | $123,680 |
| 2018 | $1,784 | $148,680 | $25,000 | $123,680 |
| 2017 | $1,754 | $148,680 | $25,000 | $123,680 |
| 2016 | $1,041 | $143,670 | $25,000 | $118,670 |
| 2015 | $1,695 | $143,670 | $25,000 | $118,670 |
| 2014 | $1,695 | $143,670 | $25,000 | $118,670 |
Source: Public Records
Map
Nearby Homes
- 308 Patrick Ave SW
- 4294 Kiser Woods Dr SW
- 4274 Kiser Woods Dr SW
- 1079 Matchstick Place SW
- 4227 Kiser Woods Dr SW
- 1123 Burning Embers Ln SW
- 1150 Hearth Ln SW
- 1153 Burning Embers Ln SW
- 4436 Falls Lake Dr SW
- 5356 Zion Church Rd
- 188 Mary Cir
- 123 Softwind Ln
- 4410 Zion Church Rd
- 910/820 Archibald Rd
- 1668 Old Charlotte Rd
- 5632 Zion Church Rd
- 5016 Hildreth Ct
- 1040 Castle Rock Ct
- 4194 Clifftonville Ave SW
- 1044 Sandy Point Dr SW
- 4291 Kiser Woods Dr SW
- 4299 Kiser Woods Dr SW
- 296 Patrick Ave SW
- 4287 Kiser Woods Dr SW
- 4303 Kiser Woods Dr SW
- 300 Patrick Ave SW
- 288 Patrick Ave SW
- 4298 Kiser Woods Dr SW
- 304 Patrick Ave SW
- 4290 Kiser Woods Dr SW
- 284 Patrick Ave SW
- 4307 Kiser Woods Dr SW
- 4283 Kiser Woods Dr SW
- 4302 Kiser Woods Dr SW
- 4286 Kiser Woods Dr SW
- 280 Patrick Ave SW
- 308 Patrick Ave SW Unit 37
- 4282 Kiser Woods Dr SW
- 4282 Kiser Woods Dr SW Unit 86
- 4306 Kiser Woods Dr SW
Your Personal Tour Guide
Ask me questions while you tour the home.