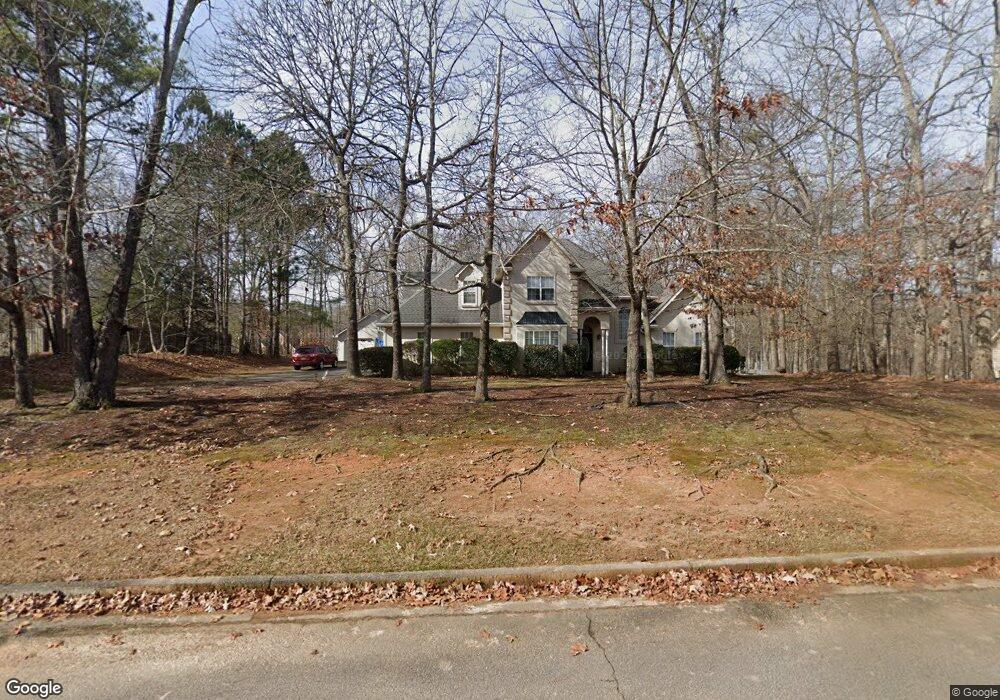
4295 Laurel Glen Ct Douglasville, GA 30135
Anneewakee NeighborhoodEstimated Value: $301,224 - $386,000
3
Beds
3
Baths
1,908
Sq Ft
$178/Sq Ft
Est. Value
About This Home
This home is located at 4295 Laurel Glen Ct, Douglasville, GA 30135 and is currently estimated at $338,806, approximately $177 per square foot. 4295 Laurel Glen Ct is a home located in Douglas County with nearby schools including Holly Springs Elementary School, Chapel Hill Middle School, and Chapel Hill High School.
Ownership History
Date
Name
Owned For
Owner Type
Purchase Details
Closed on
Jun 11, 1999
Sold by
Pair Jason L
Bought by
Sneddon Joseph and Sneddon Shirley M
Current Estimated Value
Home Financials for this Owner
Home Financials are based on the most recent Mortgage that was taken out on this home.
Original Mortgage
$113,000
Outstanding Balance
$30,934
Interest Rate
7.51%
Mortgage Type
New Conventional
Estimated Equity
$307,872
Purchase Details
Closed on
Aug 13, 1998
Sold by
Munoz Audie and Munoz Sharon A
Bought by
Pair Bill
Home Financials for this Owner
Home Financials are based on the most recent Mortgage that was taken out on this home.
Original Mortgage
$129,007
Interest Rate
6.95%
Mortgage Type
New Conventional
Purchase Details
Closed on
Nov 23, 1994
Sold by
Patriot Bldrs
Bought by
Munoz Audie Sharon
Home Financials for this Owner
Home Financials are based on the most recent Mortgage that was taken out on this home.
Original Mortgage
$130,050
Interest Rate
9.07%
Create a Home Valuation Report for This Property
The Home Valuation Report is an in-depth analysis detailing your home's value as well as a comparison with similar homes in the area
Home Values in the Area
Average Home Value in this Area
Purchase History
| Date | Buyer | Sale Price | Title Company |
|---|---|---|---|
| Sneddon Joseph | $153,000 | -- | |
| Pair Jason L | -- | -- | |
| Pair Bill | $136,300 | -- | |
| Munoz Audie Sharon | $136,900 | -- |
Source: Public Records
Mortgage History
| Date | Status | Borrower | Loan Amount |
|---|---|---|---|
| Open | Pair Jason L | $113,000 | |
| Previous Owner | Pair Bill | $129,007 | |
| Previous Owner | Munoz Audie Sharon | $130,050 |
Source: Public Records
Tax History Compared to Growth
Tax History
| Year | Tax Paid | Tax Assessment Tax Assessment Total Assessment is a certain percentage of the fair market value that is determined by local assessors to be the total taxable value of land and additions on the property. | Land | Improvement |
|---|---|---|---|---|
| 2024 | $743 | $117,880 | $23,920 | $93,960 |
| 2023 | $743 | $117,880 | $23,920 | $93,960 |
| 2022 | $771 | $96,920 | $14,120 | $82,800 |
| 2021 | $771 | $73,160 | $13,160 | $60,000 |
| 2020 | $762 | $73,160 | $13,160 | $60,000 |
| 2019 | $630 | $71,720 | $13,160 | $58,560 |
| 2018 | $630 | $63,680 | $11,920 | $51,760 |
| 2017 | $632 | $59,520 | $12,440 | $47,080 |
| 2016 | $660 | $59,600 | $12,800 | $46,800 |
| 2015 | $649 | $56,240 | $12,440 | $43,800 |
| 2014 | $519 | $44,080 | $10,360 | $33,720 |
| 2013 | -- | $44,000 | $10,360 | $33,640 |
Source: Public Records
Map
Nearby Homes
- 4220 Chapel Hill Farms Dr
- 4840 Chapel Hill Rd
- 4210 Glen Pointe Ct Unit 2
- 4015 Chapel Hill Farms Dr
- 0 E Chapel Hill Rd
- 3895 Chapel Hill Farms Ct
- 3945 Crowned Eagle
- 4299 High Country Dr
- 5473 Oconee Dr
- 4015 Soaring Dr
- 3448 Craggy Perch Unit 4
- 4232 Antler Ct
- 4401 Hampton Mill Pkwy
- 4345 Foxfire Ct
- 3939 Craggy Perch
- 4335 Foxfire Ct
- 4542 White Rd
- 4284 Laurel Glen Ct
- 5124 Eastbrook Rd
- 4291 Laurel Glen Ct Unit 1
- 0 Laurel Glen Ct Unit 8076252
- 0 Laurel Glen Ct Unit 7519723
- 0 Laurel Glen Ct
- 4283 Laurel Glen Ct Unit 1
- 5112 Eastbrook Rd Unit 1
- 4299 Laurel Glen Ct
- 4267 Laurel Glen Ct Unit 67
- 4267 Laurel Glen Ct
- 5133 Eastbrook Rd Unit 1
- 5125 Eastbrook Rd
- 5104 Eastbrook Rd
- 5117 Eastbrook Rd Unit 1
- 4255 Laurel Glen Ct
- 5145 Eastbrook Rd
- 4212 Chapel Valley Dr Unit 1
- 5135 Spring Glen Ct
- 5096 Eastbrook Rd