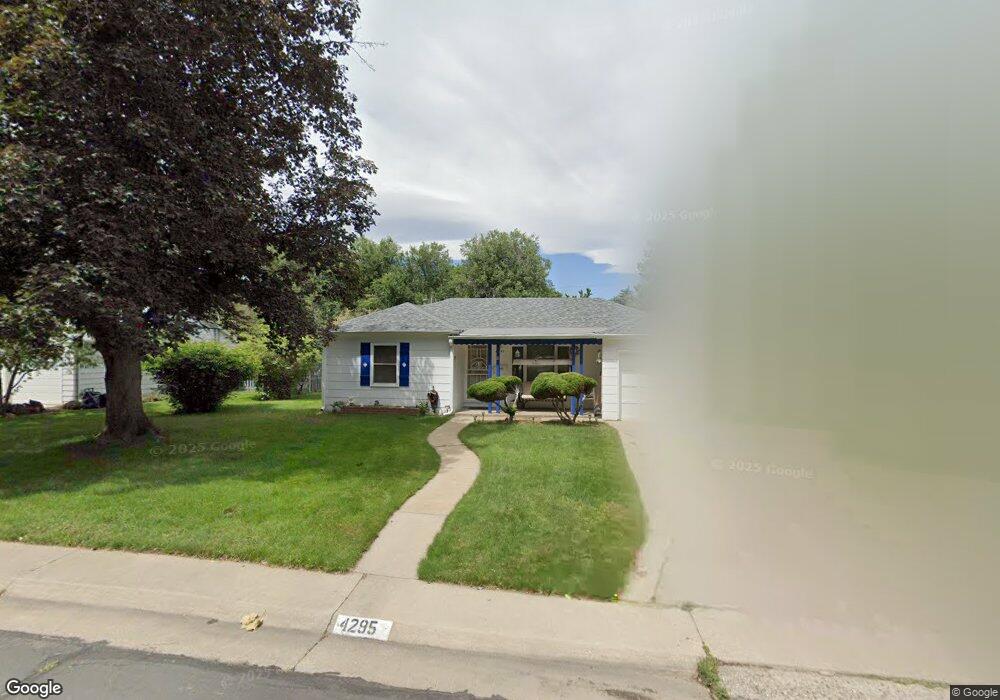
4295 Marshall St Wheat Ridge, CO 80033
Barths NeighborhoodEstimated Value: $495,229 - $597,000
2
Beds
1
Bath
1,188
Sq Ft
$465/Sq Ft
Est. Value
About This Home
This home is located at 4295 Marshall St, Wheat Ridge, CO 80033 and is currently estimated at $552,557, approximately $465 per square foot. 4295 Marshall St is a home located in Jefferson County with nearby schools including Stevens Elementary School, Everitt Middle School, and Wheat Ridge High School.
Ownership History
Date
Name
Owned For
Owner Type
Purchase Details
Closed on
Aug 13, 2019
Sold by
Stecklein Susan and Estate Of Margaret M Meier
Bought by
Okorn Daniel and Stecklein Susan
Current Estimated Value
Purchase Details
Closed on
Jul 25, 1997
Sold by
Louise Plender Kathleen and John Kurtis
Bought by
Meier Margaret M
Home Financials for this Owner
Home Financials are based on the most recent Mortgage that was taken out on this home.
Original Mortgage
$107,920
Outstanding Balance
$16,433
Interest Rate
7.72%
Estimated Equity
$536,124
Purchase Details
Closed on
Oct 4, 1993
Sold by
Plender Kurtis John and Ernst Kathleen Louise
Bought by
Plender Kurtis John and Plender Kathleen Louise
Home Financials for this Owner
Home Financials are based on the most recent Mortgage that was taken out on this home.
Original Mortgage
$71,482
Interest Rate
6.96%
Mortgage Type
FHA
Create a Home Valuation Report for This Property
The Home Valuation Report is an in-depth analysis detailing your home's value as well as a comparison with similar homes in the area
Home Values in the Area
Average Home Value in this Area
Purchase History
| Date | Buyer | Sale Price | Title Company |
|---|---|---|---|
| Okorn Daniel | -- | None Available | |
| Meier Margaret M | $134,900 | -- | |
| Plender Kurtis John | -- | Stewart Title |
Source: Public Records
Mortgage History
| Date | Status | Borrower | Loan Amount |
|---|---|---|---|
| Open | Meier Margaret M | $107,920 | |
| Previous Owner | Plender Kurtis John | $71,482 |
Source: Public Records
Tax History
| Year | Tax Paid | Tax Assessment Tax Assessment Total Assessment is a certain percentage of the fair market value that is determined by local assessors to be the total taxable value of land and additions on the property. | Land | Improvement |
|---|---|---|---|---|
| 2024 | $2,165 | $31,460 | $15,725 | $15,735 |
| 2023 | $2,165 | $31,460 | $15,725 | $15,735 |
| 2022 | $1,765 | $26,780 | $15,902 | $10,878 |
| 2021 | $1,790 | $27,551 | $16,360 | $11,191 |
| 2020 | $1,524 | $24,603 | $14,549 | $10,054 |
| 2019 | $2,119 | $24,603 | $14,549 | $10,054 |
| 2018 | $1,202 | $20,690 | $9,348 | $11,342 |
| 2017 | $1,085 | $20,690 | $9,348 | $11,342 |
| 2016 | $823 | $17,527 | $6,280 | $11,247 |
| 2015 | $628 | $17,527 | $6,280 | $11,247 |
| 2014 | $628 | $13,707 | $5,731 | $7,976 |
Source: Public Records
Map
Nearby Homes
- 4170 Lamar St
- 4365 Kendall St
- 6625 W 44th Place
- 4295 Harlan St
- 7010 W 44th Ave
- 7005 W 44th Ave
- 3830 Otis St Unit 1-4
- 6455 W 38th Ave
- 5926 W 41st Ave Unit 10
- 6735 W 37th Place
- 4015 Fenton Ct
- 4020 Fenton Ct Unit 4020
- 5755 W 43rd Ave
- 3916 Upham St
- 4018 Upham St
- 3908 Upham St
- 7350 W 44th Place
- 4730 Pierce St
- 3697 N Harlan St
- 6920 W 48th Ave Unit 6920
- 4285 Marshall St
- 4280 Newland St
- 4270 Newland St
- 4311 Marshall St
- 4265 Marshall St
- 4300 Newland St
- 4290 Marshall St
- 4300 Marshall St
- 4280 Marshall St
- 4320 Newland St
- 4331 Marshall St
- 4255 Marshall St
- 4310 Marshall St
- 4260 Marshall St
- 4240 Newland St
- 4320 Marshall St
- 4265 Newland St
- 4275 Newland St
- 4330 Newland St
- 4255 Lamar St
Your Personal Tour Guide
Ask me questions while you tour the home.