4295 W Lindbergh Way Chandler, AZ 85226
West Chandler NeighborhoodEstimated Value: $1,903,527 - $2,240,000
--
Bed
5
Baths
3,609
Sq Ft
$570/Sq Ft
Est. Value
About This Home
This home is located at 4295 W Lindbergh Way, Chandler, AZ 85226 and is currently estimated at $2,056,509, approximately $569 per square foot. 4295 W Lindbergh Way is a home located in Maricopa County with nearby schools including Kyrene de la Paloma School, Kyrene del Pueblo Middle School, and Corona Del Sol High School.
Ownership History
Date
Name
Owned For
Owner Type
Purchase Details
Closed on
Jul 3, 2024
Sold by
Debrie Ivey Az Residential Llc
Bought by
Debrie Ivey 4295 W Lindbergh Way Llc
Current Estimated Value
Purchase Details
Closed on
Sep 11, 2019
Sold by
Debrie Ivey Properties Llc
Bought by
Debrie Ivey Residential Llc
Purchase Details
Closed on
Apr 14, 2017
Sold by
Ivey Debrie K
Bought by
Debrie Ivey Properties Llc
Purchase Details
Closed on
Nov 18, 2016
Sold by
Ivey Loyd L
Bought by
Ivey Debrie K
Purchase Details
Closed on
Jan 19, 2007
Sold by
Kotnour Mark T and Kotnour Nancy A
Bought by
Ivey Loyd L and Ivey Debrie K
Purchase Details
Closed on
Mar 11, 2004
Sold by
Kotnour Mark T and Kotnour Nancy A
Bought by
Kotnour Mark T and Kotnour Nancy A
Purchase Details
Closed on
Feb 23, 2004
Sold by
Ivey Loyd L and Ivey Debrie K
Bought by
Valencia Homes Inc
Purchase Details
Closed on
Dec 28, 2001
Sold by
Stellar Airpark Estates Llc
Bought by
Kotnour Mark T and Kotnour Nancy A
Create a Home Valuation Report for This Property
The Home Valuation Report is an in-depth analysis detailing your home's value as well as a comparison with similar homes in the area
Home Values in the Area
Average Home Value in this Area
Purchase History
| Date | Buyer | Sale Price | Title Company |
|---|---|---|---|
| Debrie Ivey 4295 W Lindbergh Way Llc | -- | None Listed On Document | |
| Debrie Ivey Residential Llc | -- | None Available | |
| Debrie Ivey Properties Llc | -- | None Available | |
| Ivey Debrie K | -- | None Available | |
| Ivey Loyd L | $1,750,000 | Security Title Agency Inc | |
| Kotnour Mark T | -- | -- | |
| Valencia Homes Inc | $1,500,000 | Security Title Agency | |
| Kotnour Mark T | $162,000 | Chicago Title Insurance Co |
Source: Public Records
Tax History Compared to Growth
Tax History
| Year | Tax Paid | Tax Assessment Tax Assessment Total Assessment is a certain percentage of the fair market value that is determined by local assessors to be the total taxable value of land and additions on the property. | Land | Improvement |
|---|---|---|---|---|
| 2025 | $13,749 | $144,321 | -- | -- |
| 2024 | $13,162 | $137,449 | -- | -- |
| 2023 | $13,162 | $160,950 | $32,190 | $128,760 |
| 2022 | $12,602 | $124,670 | $24,930 | $99,740 |
| 2021 | $14,323 | $130,610 | $26,120 | $104,490 |
| 2020 | $14,636 | $129,850 | $25,970 | $103,880 |
| 2019 | $15,001 | $130,330 | $26,060 | $104,270 |
| 2018 | $15,283 | $132,710 | $26,540 | $106,170 |
| 2017 | $14,626 | $142,710 | $28,540 | $114,170 |
| 2016 | $14,830 | $164,870 | $32,970 | $131,900 |
| 2015 | $13,663 | $129,460 | $25,890 | $103,570 |
Source: Public Records
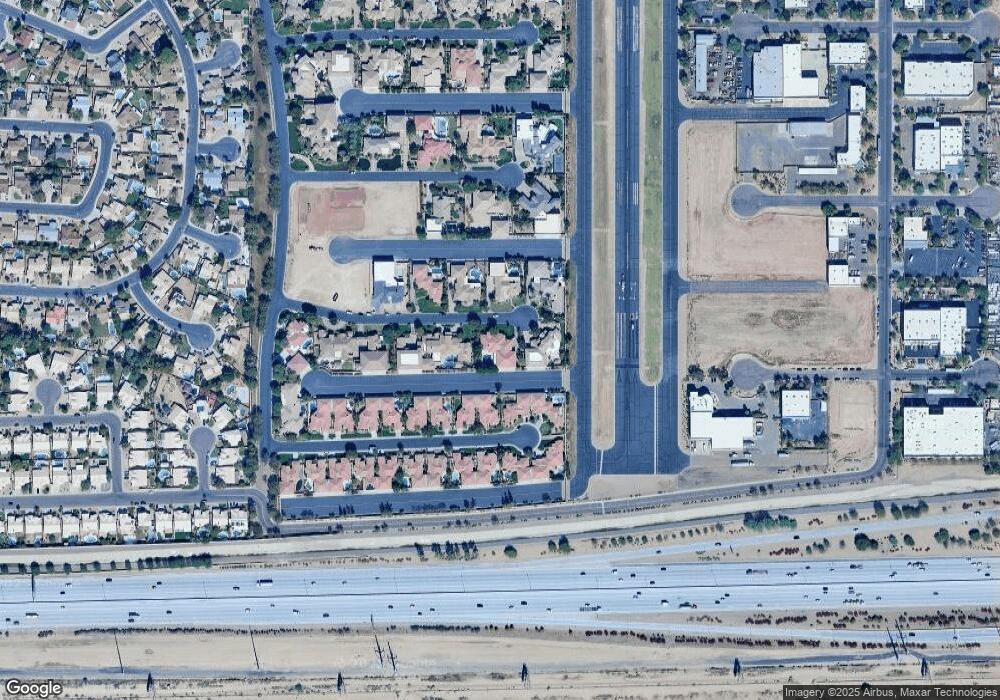
Map
Nearby Homes
- 4650 W Geronimo St
- 4790 W Geronimo St
- 3841 W Elgin St
- 4613 W Chicago St Unit 2
- 4624 W Chicago St
- 4612 W Jupiter Way
- 3641 W Saragosa St
- 4918 W Chicago St
- 5043 W Whitten St
- 5041 W Kesler Ln
- 3608 W Fairview Ln
- 3605 W Pecos Rd
- 4628 W Buffalo St
- 5137 W Jupiter Way
- 4554 W Detroit St
- 5330 W Kesler Ln
- 5143 W Mercury Way
- 390 N Enterprise Place Unit B37
- 390 N Enterprise Place Unit A6
- 5361 W Saragosa St
- 4140 W Lindbergh Way Unit 69
- 4130 W Lindbergh Way Unit 68
- 4454 W Lindbergh Way Unit 31A
- 4255 W Lindbergh Way
- 4294 W Lindbergh Way
- 4316 W Rickenbacker Way
- 4336 W Rickenbacker Way
- 4375 W Lindbergh Way
- 4334 W Lindbergh Way
- 4356 W Rickenbacker Way
- 4254 W Lindbergh Way
- 4256 W Rickenbacker Way
- 4376 W Rickenbacker Way
- 4374 W Lindbergh Way
- 4396 W Rickenbacker Way
- 4337 W Rickenbacker Way
- 4317 W Rickenbacker Way
- 4257 W Rickenbacker Way
- 4357 W Rickenbacker Way
- 4416 W Rickenbacker Way