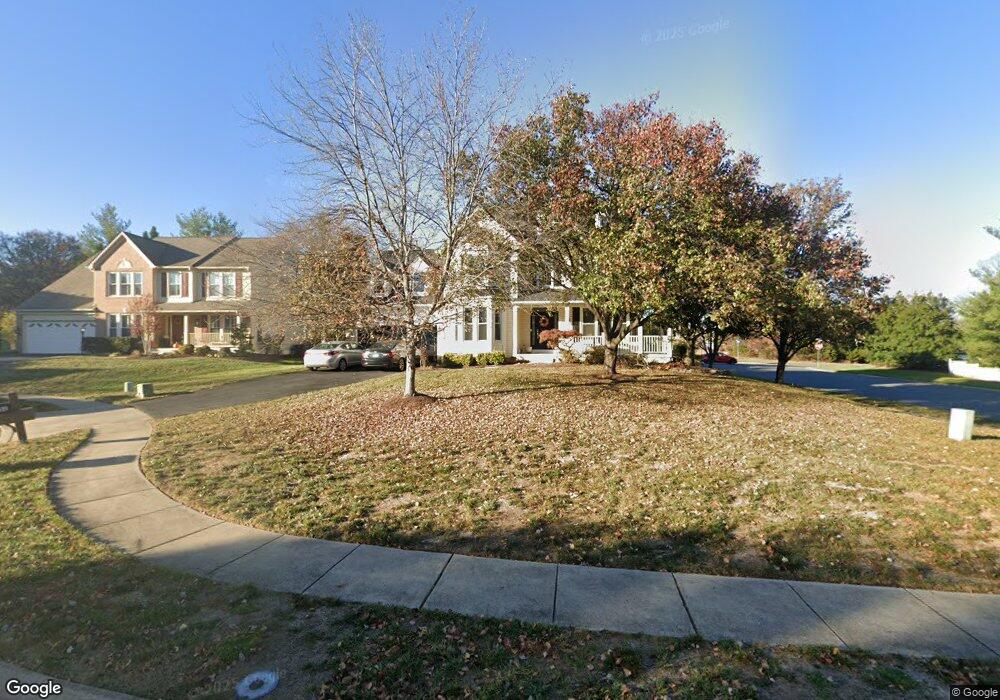
42952 Burnthill Ct Ashburn, VA 20147
Estimated Value: $943,801 - $1,025,000
4
Beds
4
Baths
2,752
Sq Ft
$362/Sq Ft
Est. Value
About This Home
This home is located at 42952 Burnthill Ct, Ashburn, VA 20147 and is currently estimated at $996,450, approximately $362 per square foot. 42952 Burnthill Ct is a home located in Loudoun County with nearby schools including Sanders Corner Elementary School, Trailside Middle School, and Stone Bridge High.
Ownership History
Date
Name
Owned For
Owner Type
Purchase Details
Closed on
Jul 21, 2010
Sold by
Henderson Scotland W
Bought by
Ahmad Sarah
Current Estimated Value
Home Financials for this Owner
Home Financials are based on the most recent Mortgage that was taken out on this home.
Original Mortgage
$550,091
Outstanding Balance
$366,273
Interest Rate
4.76%
Mortgage Type
FHA
Estimated Equity
$630,177
Purchase Details
Closed on
Jul 5, 2000
Sold by
Elwell Michael
Bought by
Henderson Scotland
Home Financials for this Owner
Home Financials are based on the most recent Mortgage that was taken out on this home.
Original Mortgage
$280,700
Interest Rate
8.1%
Purchase Details
Closed on
Jul 3, 1995
Sold by
Richmond Am Homes Of Va Inc
Bought by
Elwell Michael R
Home Financials for this Owner
Home Financials are based on the most recent Mortgage that was taken out on this home.
Original Mortgage
$264,500
Interest Rate
7.8%
Create a Home Valuation Report for This Property
The Home Valuation Report is an in-depth analysis detailing your home's value as well as a comparison with similar homes in the area
Home Values in the Area
Average Home Value in this Area
Purchase History
| Date | Buyer | Sale Price | Title Company |
|---|---|---|---|
| Ahmad Sarah | $557,500 | -- | |
| Henderson Scotland | $350,900 | -- | |
| Elwell Michael R | $293,900 | -- |
Source: Public Records
Mortgage History
| Date | Status | Borrower | Loan Amount |
|---|---|---|---|
| Open | Ahmad Sarah | $550,091 | |
| Previous Owner | Henderson Scotland | $280,700 | |
| Previous Owner | Elwell Michael R | $264,500 |
Source: Public Records
Tax History Compared to Growth
Tax History
| Year | Tax Paid | Tax Assessment Tax Assessment Total Assessment is a certain percentage of the fair market value that is determined by local assessors to be the total taxable value of land and additions on the property. | Land | Improvement |
|---|---|---|---|---|
| 2025 | $7,633 | $948,210 | $301,500 | $646,710 |
| 2024 | $7,380 | $853,180 | $300,500 | $552,680 |
| 2023 | $7,205 | $823,390 | $300,500 | $522,890 |
| 2022 | $6,900 | $775,240 | $270,500 | $504,740 |
| 2021 | $6,693 | $682,920 | $220,500 | $462,420 |
| 2020 | $6,648 | $642,320 | $201,500 | $440,820 |
| 2019 | $6,549 | $626,650 | $201,500 | $425,150 |
| 2018 | $6,403 | $590,180 | $181,500 | $408,680 |
| 2017 | $6,306 | $560,550 | $181,500 | $379,050 |
| 2016 | $6,320 | $552,000 | $0 | $0 |
| 2015 | $6,382 | $380,800 | $0 | $380,800 |
| 2014 | $6,211 | $356,260 | $0 | $356,260 |
Source: Public Records
Map
Nearby Homes
- 42764 Keiller Terrace
- 43218 Chokeberry Square
- 20419 Charter Oak Dr
- 20900 Hollyberry Ct
- 20603 Geddes Terrace
- 42686 Tunstall Terrace
- 20653 Southwind Terrace
- SKYE Plan at Goose Creek Village
- HARRIDAN Plan at Goose Creek Village
- 20775 Lamlash Terrace
- 20867 Murry Falls Terrace
- 20869 Murry Falls Terrace
- 20871 Murry Falls Terrace
- 20873 Murry Falls Terrace
- 20875 Murry Falls Terrace
- 42662 Darala Dr
- 20877 Murry Falls Terrace
- 000 Murry Falls Terrace
- 0000 Murry Falls Terrace
- 20879 Murry Falls Terrace
- 42944 Burnthill Ct
- 42960 Hedgeapple Ct
- 42940 Burnthill Ct
- 42953 Burnthill Ct
- 42949 Burnthill Ct
- 42964 Hedgeapple Ct
- 42941 Burnthill Ct
- 42961 Hedgeapple Ct
- 42945 Burnthill Ct
- 42968 Hedgeapple Ct
- 42965 Hedgeapple Ct
- 42972 Hedgeapple Ct
- 42973 Hedgeapple Ct
- 42947 Gotham Way
- 42951 Gotham Way
- 20723 Spiceberry Ct
- 42976 Hedgeapple Ct
- 20674 Citation Dr
- 42943 Gotham Way
- 42961 Ohara Ct