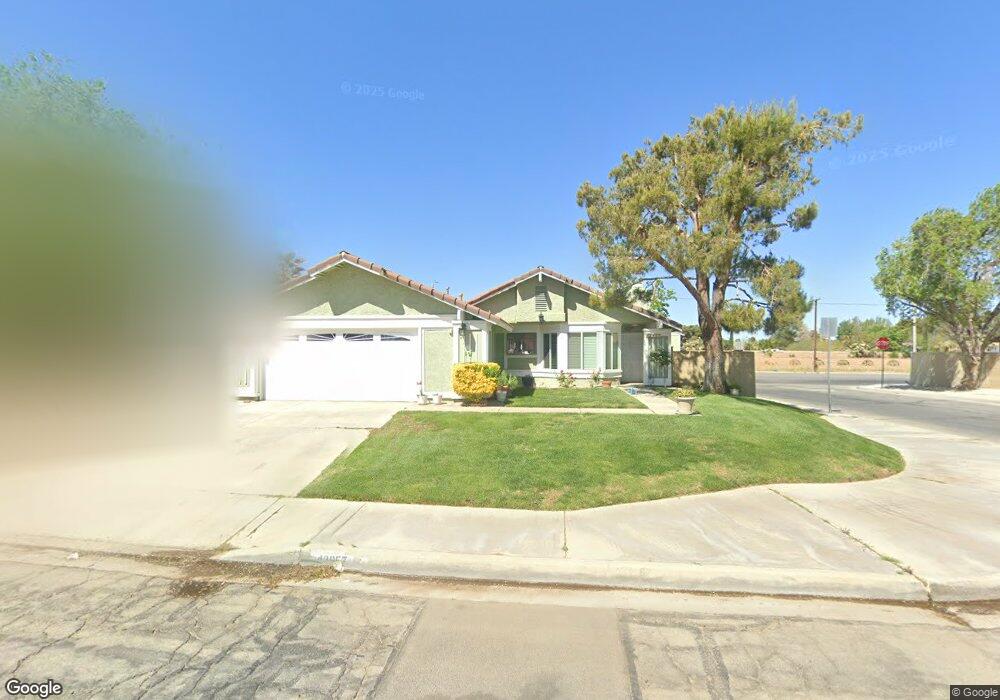
42957 39th St W Lancaster, CA 93536
West Lancaster NeighborhoodEstimated Value: $405,000 - $434,000
About This Home
This home is located at 42957 39th St W, Lancaster, CA 93536 and is currently estimated at $415,468, approximately $393 per square foot. 42957 39th St W is a home located in Los Angeles County with nearby schools including Nancy Cory Elementary School, Endeavour Middle School, and Lancaster High School.
Ownership History
We collect this data history from publicly available records. To have your information removed, we recommend requesting removal directly through your county’s website.
Purchase Details
Home Financials for this Owner
Home Financials are based on the most recent Mortgage that was taken out on this home.Purchase Details
Home Financials for this Owner
Home Financials are based on the most recent Mortgage that was taken out on this home.Purchase Details
Home Financials for this Owner
Home Financials are based on the most recent Mortgage that was taken out on this home.Purchase Details
Home Financials for this Owner
Home Financials are based on the most recent Mortgage that was taken out on this home.Purchase Details
Home Financials for this Owner
Home Financials are based on the most recent Mortgage that was taken out on this home.Purchase Details
Home Financials for this Owner
Home Financials are based on the most recent Mortgage that was taken out on this home.Purchase Details
Home Financials for this Owner
Home Financials are based on the most recent Mortgage that was taken out on this home.Purchase Details
Home Financials for this Owner
Home Financials are based on the most recent Mortgage that was taken out on this home.Purchase Details
Home Financials for this Owner
Home Financials are based on the most recent Mortgage that was taken out on this home.Purchase Details
Home Financials for this Owner
Home Financials are based on the most recent Mortgage that was taken out on this home.Purchase Details
Purchase Details
Purchase Details
Home Financials for this Owner
Home Financials are based on the most recent Mortgage that was taken out on this home.Home Values in the Area
Average Home Value in this Area
Purchase History
We collect this data history from publicly available records. To have your information removed, we recommend requesting removal directly through your county’s website.
| Date | Buyer | Sale Price | Title Company |
|---|---|---|---|
| -- | -- | ||
| $205,000 | North American Title Company | ||
| -- | Gateway Title Company | ||
| -- | Gateway Title Company | ||
| -- | First American Title Co | ||
| $118,000 | First American Title Co | ||
| -- | Fidelity National Title Co | ||
| $91,000 | Fidelity National Title Co | ||
| -- | Fidelity National Title Co | ||
| $53,000 | Fidelity Title | ||
| -- | Fidelity Title | ||
| $53,339 | Landsafe Title | ||
| -- | Landsafe Title | ||
| -- | Continental Land Title Compa |
Mortgage History
We collect this data history from publicly available records. To have your information removed, we recommend requesting removal directly through your county’s website.
| Date | Status | Borrower | Loan Amount |
|---|---|---|---|
| Open | $164,000 | ||
| Previous Owner | $154,000 | ||
| Previous Owner | $154,000 | ||
| Previous Owner | $118,000 | ||
| Previous Owner | $90,256 | ||
| Previous Owner | $42,400 | ||
| Previous Owner | $13,000 | ||
| Closed | $41,000 |
Tax History
We collect this data history from publicly available records. To have your information removed, we recommend requesting removal directly through your county’s website.
| Year | Tax Paid | Tax Assessment Tax Assessment Total Assessment is a certain percentage of the fair market value that is determined by local assessors to be the total taxable value of land and additions on the property. | Land | Improvement |
|---|---|---|---|---|
| 2025 | $4,964 | $285,733 | $152,483 | $133,250 |
| 2024 | $4,791 | $280,132 | $149,494 | $130,638 |
| 2023 | $4,691 | $274,640 | $146,563 | $128,077 |
| 2022 | $4,475 | $269,256 | $143,690 | $125,566 |
| 2021 | $4,076 | $263,977 | $140,873 | $123,104 |
| 2019 | $3,959 | $256,149 | $136,696 | $119,453 |
| 2018 | $3,611 | $228,000 | $122,000 | $106,000 |
| 2016 | $2,629 | $151,000 | $80,600 | $70,400 |
| 2015 | $2,778 | $164,000 | $87,500 | $76,500 |
| 2014 | $2,801 | $164,000 | $87,500 | $76,500 |
Map
- 43008 39th St W
- 43033 39th St W
- 42949 38th St W
- 42933 Alexo Dr
- 4009 W Avenue k8
- 4009 W Avenue K-8
- 3607 W Avenue k11
- 42803 Alexo Dr
- 0 43rd St W Unit E10
- 42921 Alep St
- 3518 Balmont St
- 0 W Avenue k12
- 43028 45th St W
- 42911 Normandy Ln
- 42804 Yew St
- 42865 Normandy Ln
- 43300 43rd St W
- 0 37th Stw Vic Ave Unit L4
- 0 W 37th Stw Vic Ave Unit L4
- 4150 W Avenue l4
- 42951 39th St W
- 43003 39th St W
- 42945 39th St W
- 42958 39th St W
- 42950 39th St W
- 43000 39th St W
- 43015 39th St W
- 42946 39th St W
- 42937 39th St W
- 42940 39th St W
- 43021 39th St W
- 43016 39th St W
- 42929 39th St W
- 42957 Guyman Ave
- 42949 Guyman Ave
- 42934 39th St W
- 43001 Guyman Ave
- 42945 Guyman Ave
- 43022 39th St W
- 43027 39th St W
Ask me questions while you tour the home.