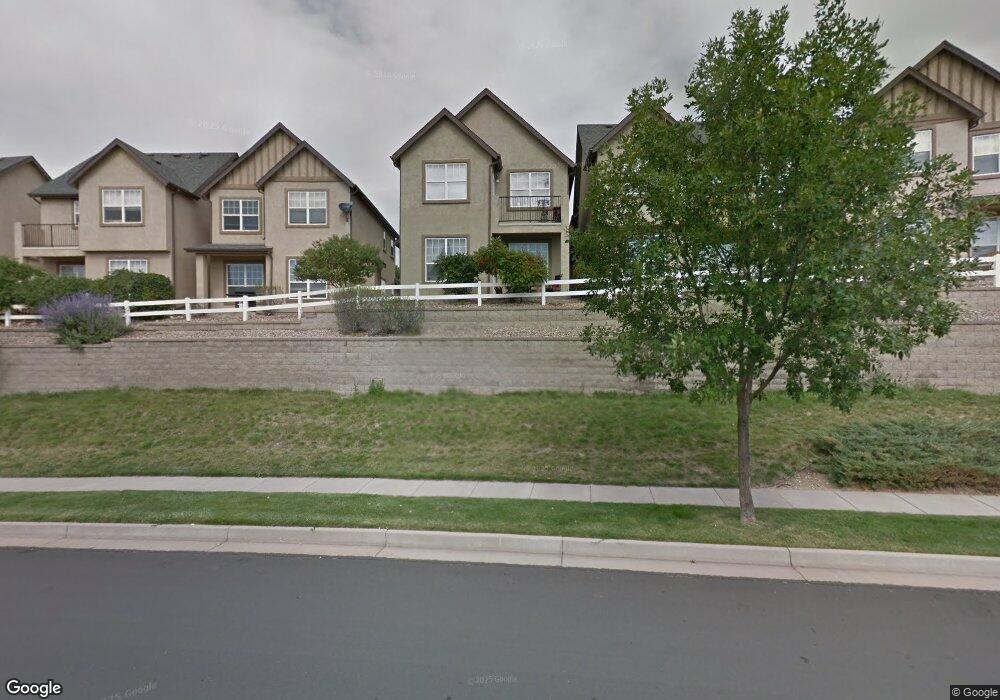
4296 Alder Springs View Unit 4296 Colorado Springs, CO 80922
Springs Ranch NeighborhoodEstimated Value: $359,461 - $388,000
2
Beds
3
Baths
1,639
Sq Ft
$230/Sq Ft
Est. Value
About This Home
This home is located at 4296 Alder Springs View Unit 4296, Colorado Springs, CO 80922 and is currently estimated at $377,365, approximately $230 per square foot. 4296 Alder Springs View Unit 4296 is a home located in El Paso County with nearby schools including Springs Ranch Elementary School, Horizon Middle School, and Sand Creek High School.
Ownership History
Date
Name
Owned For
Owner Type
Purchase Details
Closed on
Jan 2, 2015
Sold by
Demoss Eve H and Demoss Ed D
Bought by
Hackford Romany and Holcomb Jkevin
Current Estimated Value
Home Financials for this Owner
Home Financials are based on the most recent Mortgage that was taken out on this home.
Original Mortgage
$63,000
Outstanding Balance
$22,225
Interest Rate
4.01%
Mortgage Type
New Conventional
Estimated Equity
$355,140
Purchase Details
Closed on
Mar 17, 2006
Sold by
Springs Ranch Partners Llc
Bought by
Demoss Ed D and Demoss Eve H
Home Financials for this Owner
Home Financials are based on the most recent Mortgage that was taken out on this home.
Original Mortgage
$157,176
Interest Rate
5.62%
Mortgage Type
Fannie Mae Freddie Mac
Create a Home Valuation Report for This Property
The Home Valuation Report is an in-depth analysis detailing your home's value as well as a comparison with similar homes in the area
Home Values in the Area
Average Home Value in this Area
Purchase History
| Date | Buyer | Sale Price | Title Company |
|---|---|---|---|
| Hackford Romany | $194,300 | Empire Title Co Springs Llc | |
| Demoss Ed D | $196,470 | Security Title |
Source: Public Records
Mortgage History
| Date | Status | Borrower | Loan Amount |
|---|---|---|---|
| Open | Hackford Romany | $63,000 | |
| Previous Owner | Demoss Ed D | $157,176 |
Source: Public Records
Tax History Compared to Growth
Tax History
| Year | Tax Paid | Tax Assessment Tax Assessment Total Assessment is a certain percentage of the fair market value that is determined by local assessors to be the total taxable value of land and additions on the property. | Land | Improvement |
|---|---|---|---|---|
| 2025 | $1,237 | $25,510 | -- | -- |
| 2024 | $1,138 | $24,780 | $4,420 | $20,360 |
| 2023 | $1,138 | $24,780 | $4,420 | $20,360 |
| 2022 | $1,070 | $18,350 | $2,710 | $15,640 |
| 2021 | $1,115 | $18,880 | $2,790 | $16,090 |
| 2020 | $986 | $16,490 | $2,620 | $13,870 |
| 2019 | $975 | $16,490 | $2,620 | $13,870 |
| 2018 | $892 | $14,780 | $2,160 | $12,620 |
| 2017 | $896 | $14,780 | $2,160 | $12,620 |
| 2016 | $873 | $14,200 | $2,070 | $12,130 |
| 2015 | $874 | $14,200 | $2,070 | $12,130 |
| 2014 | $883 | $14,060 | $1,430 | $12,630 |
Source: Public Records
Map
Nearby Homes
- 4354 Round Hill Dr
- 7104 Ash Creek Heights Unit 203
- 6984 Ash Creek Heights Unit 204
- 7004 Ash Creek Heights Unit 201
- 7084 Ash Creek Heights Unit 201
- 4180 Slice Dr
- 7215 Amber Ridge Dr
- 4148 Heathmoor Dr
- 6980 Ashley Dr
- 4126 Fellsland Dr
- 4240 Tee Shot Dr
- 6835 Ashley Dr
- 4404 Poplar Brook Dr
- 4489 Crow Creek Dr
- 6611 Vistancia Ave
- 4007 Riviera Grove Unit 103
- 3836 Tee Shot Dr
- 4237 Stonesthrow View
- 4269 Centerville Dr
- 6759 Showhorse Ct
- 4290 Alder Springs View Unit 4290
- 4302 Alder Springs View Unit 4302
- 4308 Alder Springs View Unit 4308
- 4284 Alder Springs View Unit 4284
- 4314 Alder Springs View Unit 4314
- 4278 Alder Springs View Unit 4278
- 4320 Alder Springs View Unit 4320
- 4272 Alder Springs View Unit 4272
- 4301 Alder Springs View Unit 4301
- 4307 Alder Springs View Unit 4307
- 4283 Alder Springs View Unit 4283
- 4326 Alder Springs View Unit 4326
- 4266 Alder Springs View Unit 4266
- 6895 Amber Ridge Dr
- 4313 Alder Springs View Unit 4313
- 4277 Alder Springs View Unit 4277
- 6885 Amber Ridge Dr
- 4332 Alder Springs View Unit 4332
- 4319 Alder Springs View Unit 4319
- 6905 Amber Ridge Dr