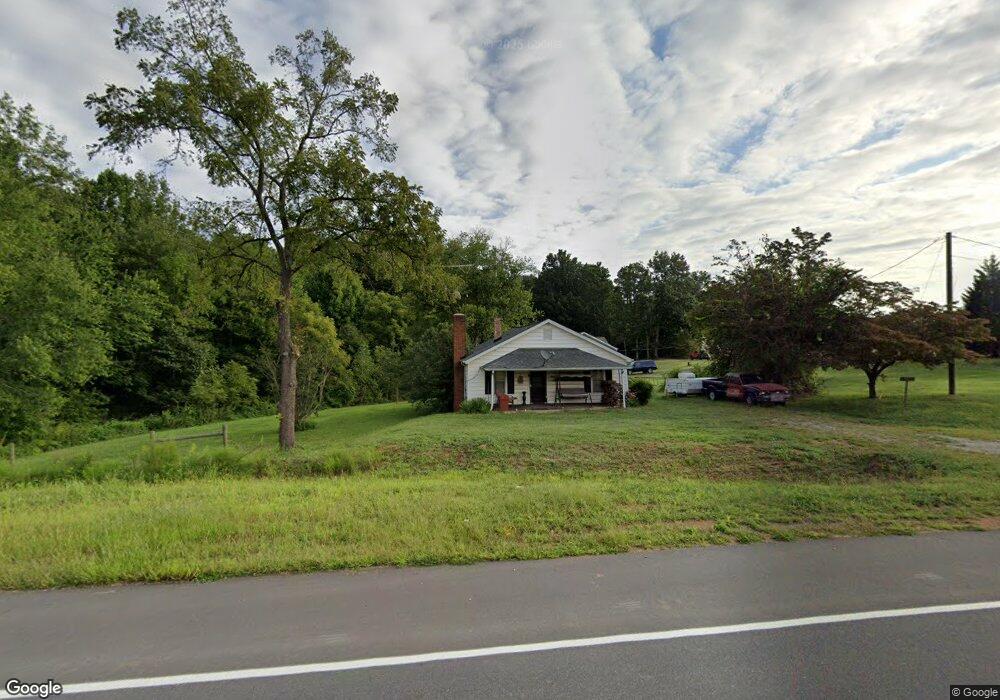
4296 S Nc 16 Hwy Maiden, NC 28650
Estimated Value: $128,000 - $231,000
2
Beds
1
Bath
676
Sq Ft
$272/Sq Ft
Est. Value
About This Home
This home is located at 4296 S Nc 16 Hwy, Maiden, NC 28650 and is currently estimated at $183,879, approximately $272 per square foot. 4296 S Nc 16 Hwy is a home located in Catawba County with nearby schools including Balls Creek Elementary School, Bandys High School, and Mill Creek Middle School.
Ownership History
Date
Name
Owned For
Owner Type
Purchase Details
Closed on
May 23, 2022
Sold by
Lee Joines Jason and Lee Crystal
Bought by
Joines Jason Lee
Current Estimated Value
Purchase Details
Closed on
Jun 10, 2020
Sold by
Joines Marion Elizabeth and Joines Jason Lee
Bought by
Joines Jason Lee and Joines Crystal
Purchase Details
Closed on
May 27, 2020
Sold by
Joines Marion Elizabeth and Joines Jason Lee
Bought by
Joines Jason Lee and Joines Crystal
Purchase Details
Closed on
Mar 20, 2020
Sold by
Joines Marion Elizabeth
Bought by
Joines Jason Lee and Joines Crystal
Home Financials for this Owner
Home Financials are based on the most recent Mortgage that was taken out on this home.
Original Mortgage
$213,135
Interest Rate
3.3%
Mortgage Type
Construction
Purchase Details
Closed on
Aug 5, 2016
Sold by
Mitchell Joseph Brent
Bought by
Joines Marion Elizabeth and Joines Jason Lee
Purchase Details
Closed on
Apr 1, 1993
Bought by
Wray James William and Wray Jane S
Create a Home Valuation Report for This Property
The Home Valuation Report is an in-depth analysis detailing your home's value as well as a comparison with similar homes in the area
Home Values in the Area
Average Home Value in this Area
Purchase History
| Date | Buyer | Sale Price | Title Company |
|---|---|---|---|
| Joines Jason Lee | -- | None Listed On Document | |
| Joines Jason Lee | -- | None Available | |
| Joines Jason Lee | -- | None Available | |
| Joines Jason Lee | -- | None Available | |
| Joines Marion Elizabeth | -- | Attorney | |
| Wray James William | $45,000 | -- |
Source: Public Records
Mortgage History
| Date | Status | Borrower | Loan Amount |
|---|---|---|---|
| Previous Owner | Joines Jason Lee | $213,135 |
Source: Public Records
Tax History Compared to Growth
Tax History
| Year | Tax Paid | Tax Assessment Tax Assessment Total Assessment is a certain percentage of the fair market value that is determined by local assessors to be the total taxable value of land and additions on the property. | Land | Improvement |
|---|---|---|---|---|
| 2025 | $593 | $119,000 | $13,800 | $105,200 |
| 2024 | $593 | $119,000 | $13,800 | $105,200 |
| 2023 | $568 | $59,100 | $13,800 | $45,300 |
| 2022 | $408 | $59,100 | $13,800 | $45,300 |
| 2021 | $408 | $59,100 | $13,800 | $45,300 |
| 2020 | $406 | $58,800 | $13,600 | $45,200 |
| 2019 | $384 | $58,800 | $0 | $0 |
| 2018 | $340 | $51,700 | $13,100 | $38,600 |
| 2017 | $340 | $0 | $0 | $0 |
| 2016 | $346 | $0 | $0 | $0 |
| 2015 | $359 | $52,630 | $14,000 | $38,630 |
| 2014 | $359 | $59,800 | $14,000 | $45,800 |
Source: Public Records
Map
Nearby Homes
- 3125 Winfield Dr
- 3331 Cayton Dr
- 4499 Briarcreek Rd
- 4550 Briarcreek Rd
- 3309 Meadow Wood Ct
- 3300 Meadow Wood Ct
- 3315 Meadow Wood Ct
- 3306 Meadow Wood Ct
- 3321 Meadow Wood Ct
- 3312 Meadow Wood Ct
- 3318 Meadow Wood Ct
- Gardenia Plan at Wynswept
- Kensington Plan at Wynswept
- Maple Plan at Wynswept
- Daffodil Plan at Wynswept
- Red Cedar Plan at Wynswept
- 3210 Timber Run Ln
- 2551 Buffalo Shoals Rd
- 3225 Timber Run Ln
- 4475 N Wynswept Dr
- 4336 S Nc 16 Hwy
- 4266 S Nc 16 Hwy
- 4242 S Nc 16 Hwy
- 4242 S Nc 16 Hwy
- 4369 S Nc 16 Hwy
- 3119 Winfield Dr
- 3199 Hemlock St
- 4232 N Carolina Highway 16
- 2800 Buffalo Shoals Rd
- 3183 Hemlock St
- 3105 Winfield Dr
- 3109 Winfield Dr
- 3163 Hemlock St
- 4220 S Nc 16 Hwy
- 4197 S Nc 16 Hwy
- 4204 S Nc 16 Hwy
- 3353 Cayton Dr Unit 2
- 4314 Anderson Mountain Rd
- 3533 Cayton Dr
- 3160 Hemlock St