Estimated Value: $389,000 - $419,000
3
Beds
2
Baths
1,908
Sq Ft
$214/Sq Ft
Est. Value
About This Home
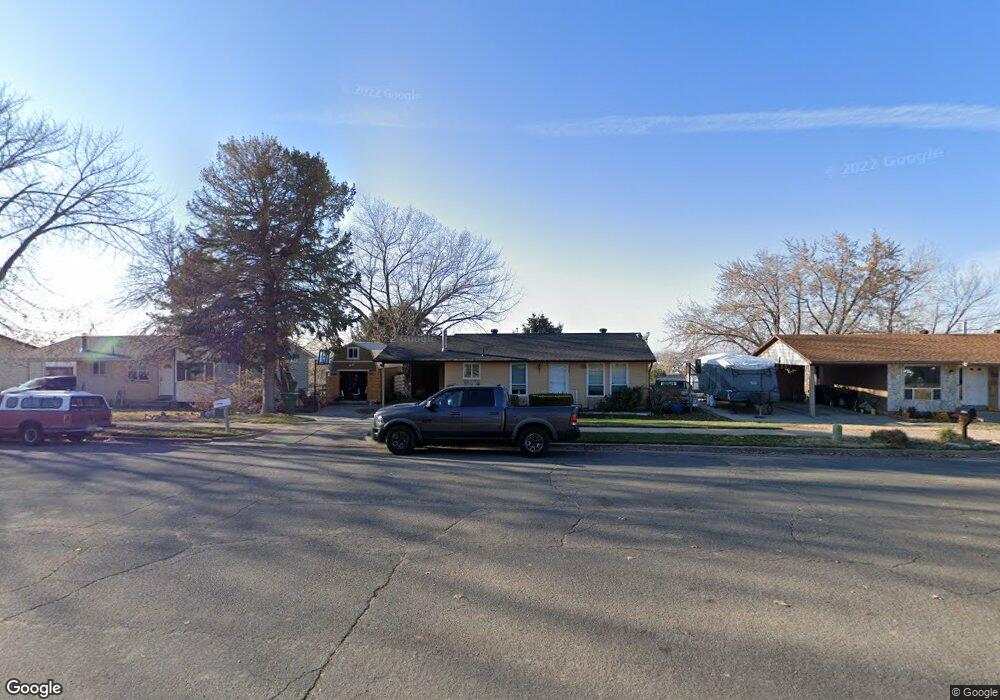
This home is located at 4299 S 2675 W, Roy, UT 84067 and is currently estimated at $408,667, approximately $214 per square foot. 4299 S 2675 W is a home located in Weber County with nearby schools including Valley View School, Sand Ridge Junior High School, and Roy High School.
Ownership History
Date
Name
Owned For
Owner Type
Purchase Details
Closed on
Jul 12, 2005
Sold by
Ivester Charles R
Bought by
Ivester Charles R
Current Estimated Value
Purchase Details
Closed on
Dec 9, 1998
Sold by
Merrill Michael Shayne and Merrill Jolene
Bought by
Palmer Mark W
Home Financials for this Owner
Home Financials are based on the most recent Mortgage that was taken out on this home.
Original Mortgage
$97,200
Interest Rate
6.78%
Mortgage Type
Purchase Money Mortgage
Create a Home Valuation Report for This Property
The Home Valuation Report is an in-depth analysis detailing your home's value as well as a comparison with similar homes in the area
Home Values in the Area
Average Home Value in this Area
Purchase History
| Date | Buyer | Sale Price | Title Company |
|---|---|---|---|
| Ivester Charles R | -- | Bonneville Title Company Sal | |
| Ivester Charles R | -- | First American Title | |
| Palmer Mark W | -- | First American Title |
Source: Public Records
Mortgage History
| Date | Status | Borrower | Loan Amount |
|---|---|---|---|
| Previous Owner | Palmer Mark W | $97,200 |
Source: Public Records
Tax History Compared to Growth
Tax History
| Year | Tax Paid | Tax Assessment Tax Assessment Total Assessment is a certain percentage of the fair market value that is determined by local assessors to be the total taxable value of land and additions on the property. | Land | Improvement |
|---|---|---|---|---|
| 2025 | $2,350 | $366,605 | $95,791 | $270,814 |
| 2024 | $2,292 | $197,999 | $52,685 | $145,314 |
| 2023 | $2,336 | $203,500 | $51,928 | $151,572 |
| 2022 | $2,177 | $193,600 | $47,370 | $146,230 |
| 2021 | $1,817 | $265,000 | $60,481 | $204,519 |
| 2020 | $1,762 | $237,000 | $60,481 | $176,519 |
| 2019 | $1,650 | $208,000 | $34,846 | $173,154 |
| 2018 | $1,563 | $185,000 | $33,087 | $151,913 |
| 2017 | $1,356 | $148,000 | $30,538 | $117,462 |
| 2016 | $1,373 | $81,192 | $16,270 | $64,922 |
| 2015 | $1,197 | $71,383 | $16,270 | $55,113 |
| 2014 | $1,156 | $67,836 | $16,270 | $51,566 |
Source: Public Records
Map
Nearby Homes
- 2642 W 4400 S
- 4118 Westlake Dr
- 4164 S 2400 W
- 2802 W 4375 S
- 2816 W 4400 S
- 2263 W 4400 S
- 2778 W 4175 S Unit 235
- 2777 W 4175 S Unit 229
- 2835 W 4200 S
- 4022 S 2725 W
- 4110 S 2275 W
- 1952 W 5450 S
- 4328 S 2175 W
- 2259 W 4525 S
- 4670 S 2525 W
- 4073 S 2175 W
- 2082 W 4450 S
- 4205 S 2075 W
- 3965 S 2225 W
- 4220 S 2075 W