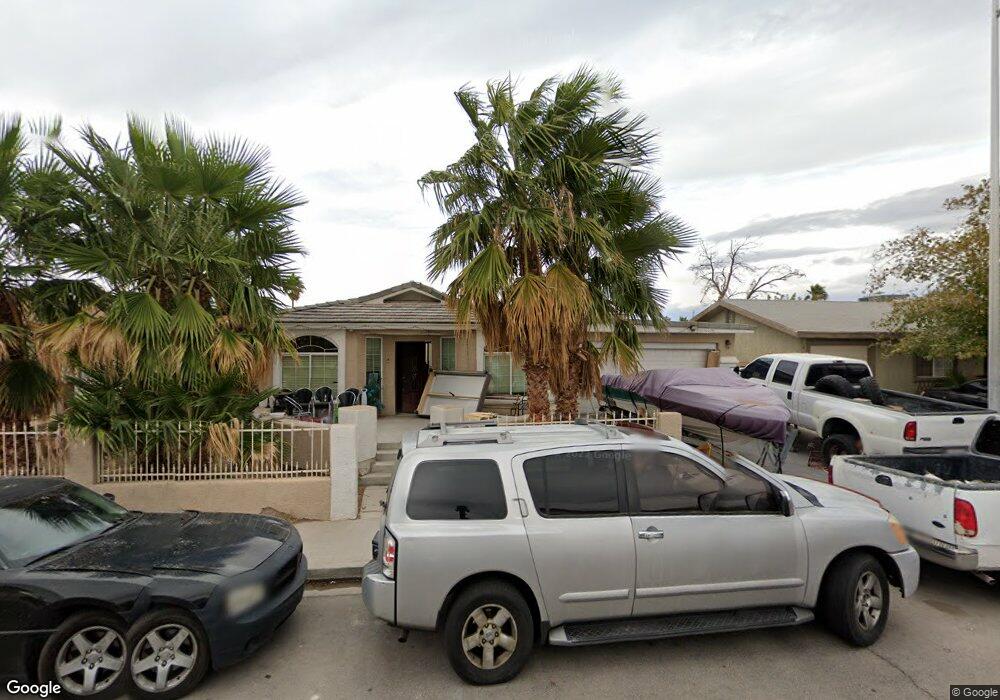
4299 Studio St Las Vegas, NV 89115
Estimated Value: $328,000 - $338,000
3
Beds
2
Baths
1,196
Sq Ft
$278/Sq Ft
Est. Value
About This Home
This home is located at 4299 Studio St, Las Vegas, NV 89115 and is currently estimated at $332,254, approximately $277 per square foot. 4299 Studio St is a home located in Clark County with nearby schools including J.E. Manch Elementary School, Zel & Mary Lowman Elementary School, and Carroll M. Johnston STEM Academy of Environmental Studies.
Ownership History
Date
Name
Owned For
Owner Type
Purchase Details
Closed on
Dec 21, 2022
Sold by
Cortes Ruben Sadot Madrigal
Bought by
Mendoza Daniel Madrigal
Current Estimated Value
Purchase Details
Closed on
Mar 21, 2002
Sold by
Hud
Bought by
Madrigal Ruben
Home Financials for this Owner
Home Financials are based on the most recent Mortgage that was taken out on this home.
Original Mortgage
$92,803
Interest Rate
6.78%
Mortgage Type
FHA
Purchase Details
Closed on
Sep 12, 2001
Sold by
Hildebrandt Kenneth D
Bought by
Chase Mtg Company and Chemical Mtg Company
Purchase Details
Closed on
Mar 28, 1994
Sold by
Thomas Jimmy Royce and Thomas Carmen Ana
Bought by
Hildebrandt Kenneth D
Home Financials for this Owner
Home Financials are based on the most recent Mortgage that was taken out on this home.
Original Mortgage
$68,518
Interest Rate
7.15%
Mortgage Type
FHA
Create a Home Valuation Report for This Property
The Home Valuation Report is an in-depth analysis detailing your home's value as well as a comparison with similar homes in the area
Home Values in the Area
Average Home Value in this Area
Purchase History
| Date | Buyer | Sale Price | Title Company |
|---|---|---|---|
| Mendoza Daniel Madrigal | -- | -- | |
| Madrigal Ruben | $92,236 | First American Title Co | |
| Chase Mtg Company | $70,953 | First American Title Co | |
| Hildebrandt Kenneth D | $68,500 | Fidelity National Title |
Source: Public Records
Mortgage History
| Date | Status | Borrower | Loan Amount |
|---|---|---|---|
| Previous Owner | Madrigal Ruben | $92,803 | |
| Previous Owner | Hildebrandt Kenneth D | $68,518 | |
| Closed | Madrigal Ruben | $3,584 |
Source: Public Records
Tax History Compared to Growth
Tax History
| Year | Tax Paid | Tax Assessment Tax Assessment Total Assessment is a certain percentage of the fair market value that is determined by local assessors to be the total taxable value of land and additions on the property. | Land | Improvement |
|---|---|---|---|---|
| 2025 | $713 | $50,059 | $27,650 | $22,409 |
| 2024 | $612 | $50,059 | $27,650 | $22,409 |
| 2023 | $679 | $48,951 | $26,950 | $22,001 |
| 2022 | $874 | $40,875 | $20,300 | $20,575 |
| 2021 | $1,074 | $39,097 | $19,250 | $19,847 |
| 2020 | $508 | $37,565 | $17,500 | $20,065 |
| 2019 | $476 | $35,149 | $15,050 | $20,099 |
| 2018 | $455 | $31,798 | $12,250 | $19,548 |
| 2017 | $896 | $30,541 | $10,500 | $20,041 |
| 2016 | $679 | $27,761 | $7,000 | $20,761 |
| 2015 | $677 | $20,052 | $3,850 | $16,202 |
| 2014 | $664 | $16,486 | $3,500 | $12,986 |
Source: Public Records
Map
Nearby Homes
- 4329 Studio St
- 4219 Studio St
- 4305 Puebla St
- 4195 Story Rock St
- 4730 E Craig Rd Unit 1020
- 4730 E Craig Rd Unit 2096
- 4730 E Craig Rd Unit 2180
- 4730 E Craig Rd Unit 2115
- 4730 E Craig Rd Unit 2163
- 4730 E Craig Rd Unit 2093
- 4730 E Craig Rd Unit 2145
- 4730 E Craig Rd Unit 1106
- 4730 E Craig Rd Unit 2154
- 4730 E Craig Rd Unit 2193
- 4730 E Craig Rd Unit 1149
- 4730 E Craig Rd Unit 1093
- 4730 E Craig Rd Unit 2028
- 4759 Pinon Pointe Rd
- 4027 Boratko St
- 4774 Valleyside Ave
- 4289 Studio St
- 4309 Studio St Unit 4
- 4298 Boratko St
- 4308 Boratko St
- 4288 Boratko St
- 4279 Studio St
- 4319 Studio St
- 4300 Studio St
- 4290 Studio St Unit 4
- 4318 Boratko St
- 4278 Boratko St
- 4310 Studio St
- 4280 Studio St
- 4269 Studio St
- 4320 Studio St
- 4328 Boratko St
- 4268 Boratko St
- 4270 Studio St
- 4259 Studio St
- 4339 Studio St