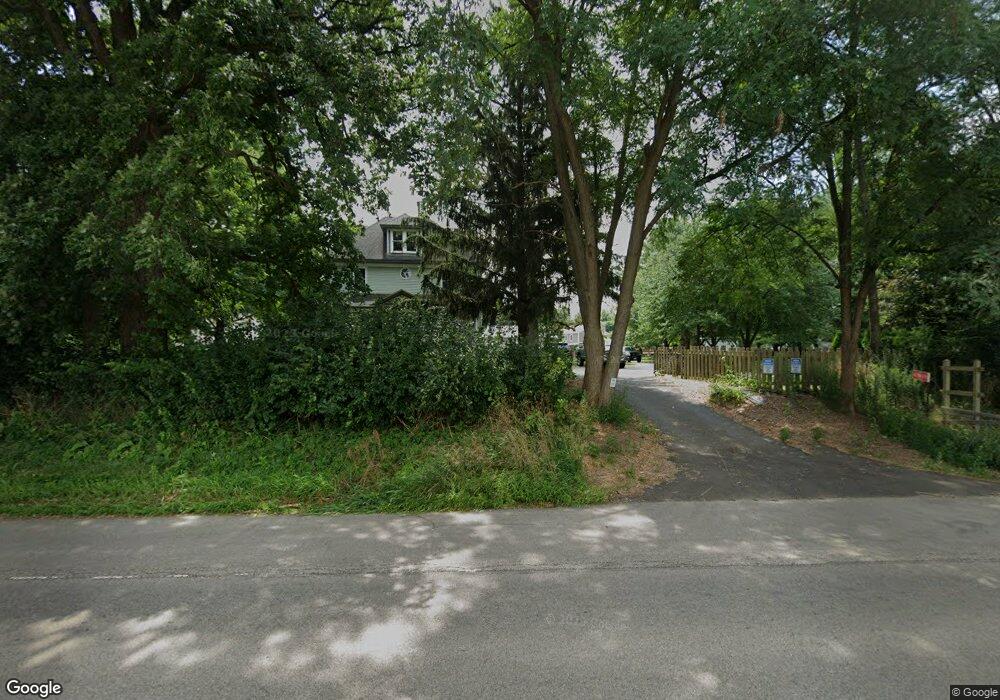
42W691 Il Route 64 Saint Charles, IL 60175
Estimated Value: $517,814 - $607,000
5
Beds
3
Baths
2,866
Sq Ft
$197/Sq Ft
Est. Value
About This Home
This home is located at 42W691 Il Route 64, Saint Charles, IL 60175 and is currently estimated at $563,454, approximately $196 per square foot. 42W691 Il Route 64 is a home located in Kane County with nearby schools including Wasco Elementary School, Thompson Middle School, and St Charles North High School.
Ownership History
Date
Name
Owned For
Owner Type
Purchase Details
Closed on
Jun 15, 2017
Sold by
Edwards Chad R and Edwards Lori H
Bought by
Berkhout Marcellino J and Sabathe Berkhout Nicole D
Current Estimated Value
Purchase Details
Closed on
May 11, 2011
Sold by
Thompson Andrew D and Thompson Ann S
Bought by
Edwards Chad R and Edwards Lori H
Home Financials for this Owner
Home Financials are based on the most recent Mortgage that was taken out on this home.
Original Mortgage
$239,875
Interest Rate
4.4%
Mortgage Type
FHA
Purchase Details
Closed on
Jul 2, 1999
Sold by
Dwyer Robert M and Dwyer Susan E
Bought by
Thompson Andrew D and Thompson Ann S
Home Financials for this Owner
Home Financials are based on the most recent Mortgage that was taken out on this home.
Original Mortgage
$240,000
Interest Rate
6.87%
Create a Home Valuation Report for This Property
The Home Valuation Report is an in-depth analysis detailing your home's value as well as a comparison with similar homes in the area
Home Values in the Area
Average Home Value in this Area
Purchase History
| Date | Buyer | Sale Price | Title Company |
|---|---|---|---|
| Berkhout Marcellino J | $289,500 | Chicago Title Insurance Co | |
| Edwards Chad R | $250,000 | Chicago Title Insurance Co | |
| Thompson Andrew D | $270,000 | -- |
Source: Public Records
Mortgage History
| Date | Status | Borrower | Loan Amount |
|---|---|---|---|
| Previous Owner | Edwards Chad R | $239,875 | |
| Previous Owner | Thompson Andrew D | $240,000 |
Source: Public Records
Tax History Compared to Growth
Tax History
| Year | Tax Paid | Tax Assessment Tax Assessment Total Assessment is a certain percentage of the fair market value that is determined by local assessors to be the total taxable value of land and additions on the property. | Land | Improvement |
|---|---|---|---|---|
| 2024 | $9,968 | $152,431 | $27,260 | $125,171 |
| 2023 | $9,747 | $136,282 | $24,372 | $111,910 |
| 2022 | $7,907 | $124,175 | $22,207 | $101,968 |
| 2021 | $7,548 | $117,246 | $20,968 | $96,278 |
| 2020 | $7,530 | $115,559 | $20,666 | $94,893 |
| 2019 | $7,429 | $113,863 | $20,363 | $93,500 |
| 2018 | $7,416 | $97,928 | $20,363 | $77,565 |
| 2017 | $7,343 | $96,490 | $20,064 | $76,426 |
| 2016 | $9,112 | $109,338 | $19,557 | $89,781 |
| 2015 | -- | $106,319 | $19,017 | $87,302 |
| 2014 | -- | $105,129 | $19,309 | $85,820 |
| 2013 | -- | $106,893 | $19,633 | $87,260 |
Source: Public Records
Map
Nearby Homes
- 43W140 Campton Hills Rd Unit 2
- 42W697 Bridle Ct
- 5N461 Hidden Springs Dr
- 42W641 Jens Jensen Ln Unit 2
- 5N683 Ravine Dr
- 4N621 Pathfinder Dr
- 42W534 Empire Rd
- 24 Autumn Ct
- LOT 1 E Sunset Views Dr
- 41W331 Empire Rd
- 41W803 Town Hall Rd
- 40W778 Ellis Johnson Ln
- 40W758 Ellis Johnson Ln
- 40W930 Trotter Ln
- 41W329 Prairie View Ln
- 1427 Garfield Dr
- 4N884 Old Lafox Rd
- Lot 15 Campton Meadow Dr
- 4N466 Mark Twain St
- 40W665 Carriage Ct
- 42W704 Whirlaway Dr
- 4N695 Council Ct
- 42W684 Whirlaway Dr
- 4N671 Council Ct
- 42W690 Il Route 64
- 42W690 Il Route 64
- 4N696 Council Ct
- 42W664 Whirlaway Dr
- 42631 W Mary Dr
- 42W669 Whirlaway Dr
- 4N617 Arrowhead Dr
- 4N670 Council Ct Unit 726
- 42W644 Whirlaway Dr
- 42W830 Whirlaway Dr
- 42W801 Whirlaway Dr Unit 2
- 4N589 Arrowhead Dr
- 4N745 Citation Ct
- 4n747 Citation Ln
- 42W637 Whirlaway Dr Unit 2
- 4N588 Arrowhead Dr