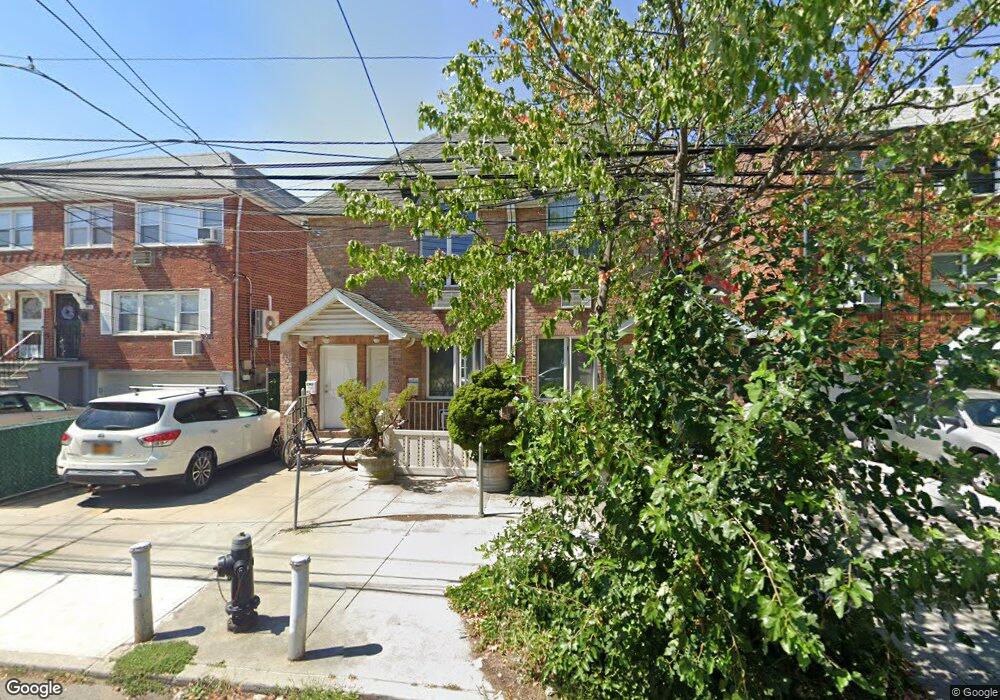
43-18 215th Place Unit 2 Bayside, NY 11361
Bayside NeighborhoodEstimated Value: $1,320,586 - $1,867,000
2
Beds
2
Baths
2,406
Sq Ft
$679/Sq Ft
Est. Value
About This Home
This home is located at 43-18 215th Place Unit 2, Bayside, NY 11361 and is currently estimated at $1,632,897, approximately $678 per square foot. 43-18 215th Place Unit 2 is a home located in Queens County with nearby schools including P.S. 31 - Bayside, M.S. 158 - Marie Curie, and Bayside High School.
Ownership History
Date
Name
Owned For
Owner Type
Purchase Details
Closed on
May 25, 2012
Sold by
Farino Jeannette J and Farino Richard
Bought by
Stars 77 Realty Corp
Current Estimated Value
Purchase Details
Closed on
Jun 4, 2007
Sold by
Farino Jeanette J
Bought by
Farino Jeanette J and Farino Richard
Purchase Details
Closed on
Jan 6, 2006
Sold by
Cafiero Ralph and Cafiero Virginia
Bought by
Farino Jeanette J
Home Financials for this Owner
Home Financials are based on the most recent Mortgage that was taken out on this home.
Original Mortgage
$184,000
Interest Rate
6.33%
Purchase Details
Closed on
Oct 24, 2005
Sold by
Cafiero Virginia and Casazza Virginia R
Bought by
Cafiero Ralph and Cafiero Virginia
Create a Home Valuation Report for This Property
The Home Valuation Report is an in-depth analysis detailing your home's value as well as a comparison with similar homes in the area
Home Values in the Area
Average Home Value in this Area
Purchase History
| Date | Buyer | Sale Price | Title Company |
|---|---|---|---|
| Stars 77 Realty Corp | $910,000 | -- | |
| Stars 77 Realty Corp | $910,000 | -- | |
| Farino Jeanette J | -- | -- | |
| Farino Jeanette J | -- | -- | |
| Farino Jeanette J | $920,000 | -- | |
| Farino Jeanette J | $920,000 | -- | |
| Cafiero Ralph | -- | -- | |
| Cafiero Ralph | -- | -- |
Source: Public Records
Mortgage History
| Date | Status | Borrower | Loan Amount |
|---|---|---|---|
| Previous Owner | Farino Jeanette J | $184,000 | |
| Previous Owner | Farino Jeanette J | $736,000 | |
| Closed | Farino Jeanette J | $0 |
Source: Public Records
Tax History Compared to Growth
Tax History
| Year | Tax Paid | Tax Assessment Tax Assessment Total Assessment is a certain percentage of the fair market value that is determined by local assessors to be the total taxable value of land and additions on the property. | Land | Improvement |
|---|---|---|---|---|
| 2025 | $13,418 | $67,361 | $11,416 | $55,945 |
| 2024 | $13,418 | $66,805 | $12,227 | $54,578 |
| 2023 | $12,810 | $63,073 | $10,062 | $53,011 |
| 2022 | $11,879 | $83,460 | $15,660 | $67,800 |
| 2021 | $11,814 | $70,500 | $15,660 | $54,840 |
| 2020 | $11,882 | $77,460 | $15,660 | $61,800 |
| 2019 | $11,646 | $83,640 | $15,660 | $67,980 |
| 2018 | $10,715 | $52,561 | $13,718 | $38,843 |
| 2017 | $10,108 | $49,586 | $12,175 | $37,411 |
| 2016 | $9,352 | $49,586 | $12,175 | $37,411 |
| 2015 | $5,642 | $46,778 | $13,006 | $33,772 |
| 2014 | $5,642 | $46,393 | $14,222 | $32,171 |
Source: Public Records
Map
Nearby Homes
- 45-21 215th St
- 42-16 215th St
- 45-38 215th Place
- 214-17 45th Dr
- 42-19 214th Place
- 4228 214th Place Unit 2A
- 4218 217th St
- 218-12 43rd Ave Unit 2E
- 218-10 43rd Ave Unit 3D
- 45-41 215th St
- 46-26 215th Place Unit 3A
- 46-26 215th Place Unit 2A
- 46-30 215th Place Unit 2A
- 40-29 216th St
- 21302 42nd Ave Unit 8D
- 46-41 215th St Unit 3A
- 46-40 216th St Unit 3B
- 4316 212th St
- 213-02 42nd Ave Unit 2F
- 42-23 212th St Unit 3B
- 43-18 215th Place Unit 2nd Fl
- 43-18 215th Place Unit 1FL
- 43-18 215th Place Unit 1FL+Ba
- 43-18 215th Place
- 4318 215th Place
- 4320 215th Place
- 4320 215th Place
- 4320 215th Place
- 4316 215th Place
- 43-22 215th Place
- 4314 215th Place
- 4322 215th Place
- 4312 215th Place
- 43-12 215th Place
- 43-12 215th Place Unit 2
- 4324 215th Place
- 4315 215th St
- 4319 215th St
- 4313 215th St
- 4321 215th St