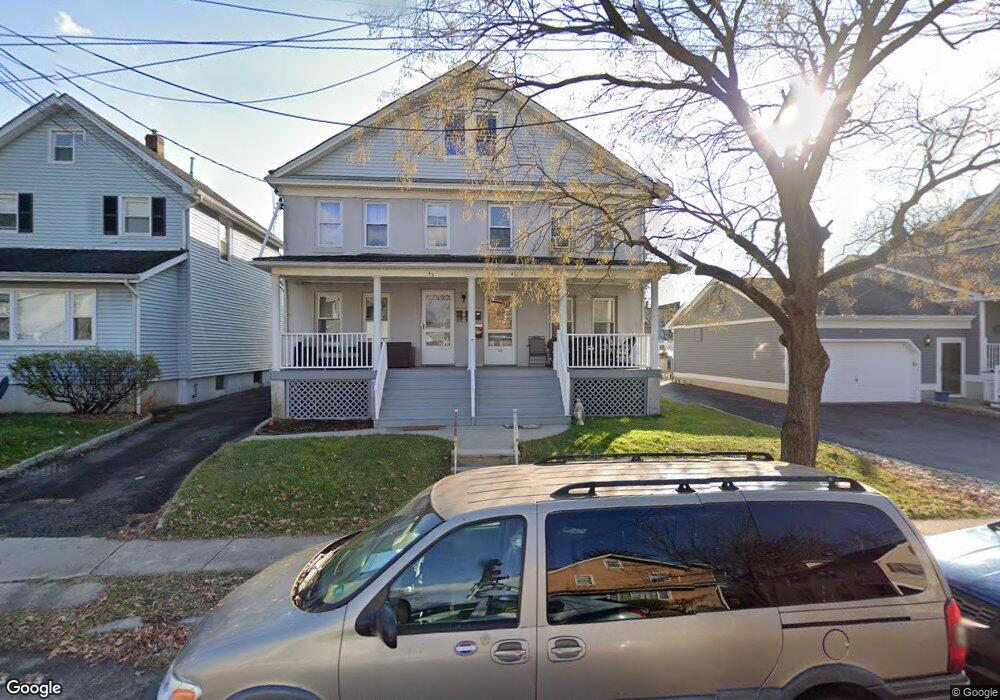
43 2nd Ave Garwood, NJ 07027
Estimated Value: $863,000 - $1,011,000
1
Bed
--
Bath
750
Sq Ft
$1,245/Sq Ft
Est. Value
About This Home
Refreshed apartment in great area , close to everything , train and buses and shopping
Very quiet area
Off street parking
Serious inquiries only
All parties must be present
Ownership History
Date
Name
Owned For
Owner Type
Purchase Details
Closed on
May 18, 2006
Sold by
Bufalini Giada
Bought by
Mezzo Alex V and Mezzo Deborah
Current Estimated Value
Home Financials for this Owner
Home Financials are based on the most recent Mortgage that was taken out on this home.
Original Mortgage
$441,600
Outstanding Balance
$258,961
Interest Rate
6.62%
Estimated Equity
$674,790
Create a Home Valuation Report for This Property
The Home Valuation Report is an in-depth analysis detailing your home's value as well as a comparison with similar homes in the area
Home Values in the Area
Average Home Value in this Area
Purchase History
| Date | Buyer | Sale Price | Title Company |
|---|---|---|---|
| Mezzo Alex V | $552,000 | -- |
Source: Public Records
Mortgage History
| Date | Status | Borrower | Loan Amount |
|---|---|---|---|
| Open | Mezzo Alex V | $441,600 |
Source: Public Records
Property History
| Date | Event | Price | List to Sale | Price per Sq Ft |
|---|---|---|---|---|
| 08/01/2024 08/01/24 | For Rent | $2,195 | -- | -- |
Tax History Compared to Growth
Tax History
| Year | Tax Paid | Tax Assessment Tax Assessment Total Assessment is a certain percentage of the fair market value that is determined by local assessors to be the total taxable value of land and additions on the property. | Land | Improvement |
|---|---|---|---|---|
| 2025 | $13,999 | $502,300 | $173,500 | $328,800 |
| 2024 | $13,582 | $502,300 | $173,500 | $328,800 |
| 2023 | $13,582 | $502,300 | $173,500 | $328,800 |
| 2022 | $13,221 | $502,300 | $173,500 | $328,800 |
| 2021 | $12,849 | $502,300 | $173,500 | $328,800 |
| 2020 | $12,643 | $502,300 | $173,500 | $328,800 |
| 2019 | $14,200 | $140,300 | $44,700 | $95,600 |
| 2018 | $13,897 | $140,300 | $44,700 | $95,600 |
| 2017 | $13,560 | $140,300 | $44,700 | $95,600 |
| 2016 | $13,211 | $140,300 | $44,700 | $95,600 |
| 2015 | $13,041 | $140,300 | $44,700 | $95,600 |
| 2014 | -- | $140,300 | $44,700 | $95,600 |
Source: Public Records
Map
Nearby Homes