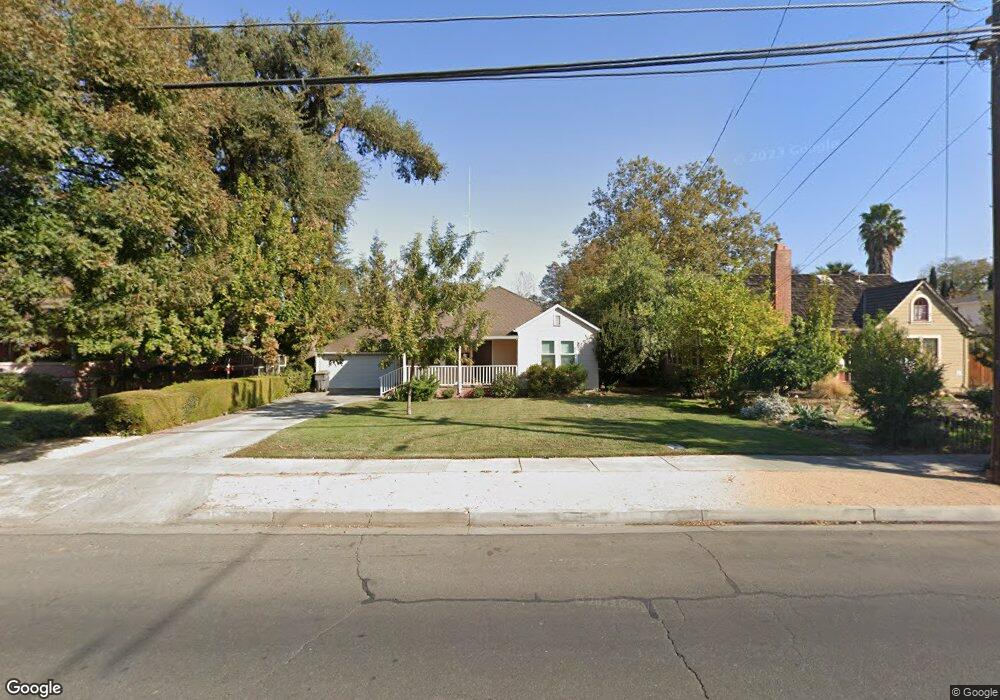
43 3rd St Woodland, CA 95695
Estimated Value: $449,957 - $545,000
3
Beds
2
Baths
1,408
Sq Ft
$350/Sq Ft
Est. Value
About This Home
This home is located at 43 3rd St, Woodland, CA 95695 and is currently estimated at $493,489, approximately $350 per square foot. 43 3rd St is a home located in Yolo County with nearby schools including Beamer Elementary School, Douglass Middle School, and Pioneer High School.
Ownership History
Date
Name
Owned For
Owner Type
Purchase Details
Closed on
May 1, 2006
Sold by
Horst Darrell Lee and Horst Flordeliza Supat
Bought by
Horst Darrell Lee and Horst Flordeliza S
Current Estimated Value
Purchase Details
Closed on
Oct 21, 2005
Sold by
Horst Darrell Lee
Bought by
Horst Darrell Lee and Horst Flordeliza Supat
Purchase Details
Closed on
Jul 17, 2001
Sold by
Horst Georgia Lynn
Bought by
Horst Darrell Lee
Home Financials for this Owner
Home Financials are based on the most recent Mortgage that was taken out on this home.
Original Mortgage
$150,750
Outstanding Balance
$57,884
Interest Rate
7.09%
Mortgage Type
Stand Alone First
Estimated Equity
$435,605
Purchase Details
Closed on
Sep 8, 1999
Sold by
Motley Scott R and Motley Kathy J
Bought by
Horst Darrell Lee and Horst Georgia Lynn
Home Financials for this Owner
Home Financials are based on the most recent Mortgage that was taken out on this home.
Original Mortgage
$16,000
Interest Rate
7.66%
Create a Home Valuation Report for This Property
The Home Valuation Report is an in-depth analysis detailing your home's value as well as a comparison with similar homes in the area
Home Values in the Area
Average Home Value in this Area
Purchase History
| Date | Buyer | Sale Price | Title Company |
|---|---|---|---|
| Horst Darrell Lee | -- | None Available | |
| Horst Darrell Lee | -- | -- | |
| Horst Darrell Lee | -- | Financial Title Company | |
| Horst Darrell Lee | -- | Placer Title Company |
Source: Public Records
Mortgage History
| Date | Status | Borrower | Loan Amount |
|---|---|---|---|
| Open | Horst Darrell Lee | $150,750 | |
| Closed | Horst Darrell Lee | $16,000 |
Source: Public Records
Tax History
| Year | Tax Paid | Tax Assessment Tax Assessment Total Assessment is a certain percentage of the fair market value that is determined by local assessors to be the total taxable value of land and additions on the property. | Land | Improvement |
|---|---|---|---|---|
| 2025 | $2,081 | $209,004 | $92,205 | $116,799 |
| 2023 | $2,081 | $200,890 | $88,626 | $112,264 |
| 2022 | $1,997 | $196,952 | $86,889 | $110,063 |
| 2021 | $1,963 | $193,091 | $85,186 | $107,905 |
| 2020 | $1,935 | $191,112 | $84,313 | $106,799 |
| 2019 | $1,897 | $187,365 | $82,660 | $104,705 |
| 2018 | $1,876 | $183,692 | $81,040 | $102,652 |
| 2017 | $1,834 | $180,091 | $79,451 | $100,640 |
| 2016 | $1,801 | $176,561 | $77,894 | $98,667 |
| 2015 | $1,739 | $173,909 | $76,724 | $97,185 |
| 2014 | $1,739 | $170,504 | $75,222 | $95,282 |
Source: Public Records
Map
Nearby Homes
Your Personal Tour Guide
Ask me questions while you tour the home.