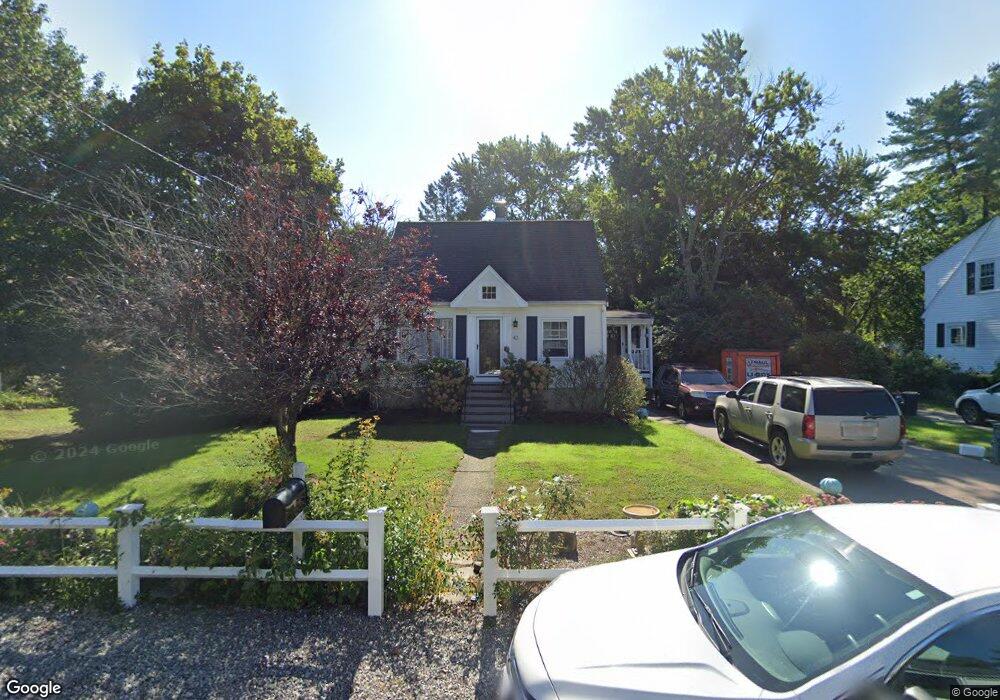
43 Adams Rd Walpole, MA 02081
Estimated Value: $579,000 - $679,000
2
Beds
1
Bath
1,573
Sq Ft
$403/Sq Ft
Est. Value
About This Home
This home is located at 43 Adams Rd, Walpole, MA 02081 and is currently estimated at $633,405, approximately $402 per square foot. 43 Adams Rd is a home located in Norfolk County with nearby schools including Fisher School, Walpole Middle School, and Walpole High School.
Ownership History
Date
Name
Owned For
Owner Type
Purchase Details
Closed on
May 30, 1997
Sold by
Hrenchuk Exr John
Bought by
Glynn Kevin J
Current Estimated Value
Home Financials for this Owner
Home Financials are based on the most recent Mortgage that was taken out on this home.
Original Mortgage
$119,900
Interest Rate
8.09%
Mortgage Type
Purchase Money Mortgage
Create a Home Valuation Report for This Property
The Home Valuation Report is an in-depth analysis detailing your home's value as well as a comparison with similar homes in the area
Home Values in the Area
Average Home Value in this Area
Purchase History
We collect this data history from publicly available records. To have your information removed, we recommend requesting removal directly through your county’s website.
| Date | Buyer | Sale Price | Title Company |
|---|---|---|---|
| Glynn Kevin J | $149,900 | -- |
Source: Public Records
Mortgage History
We collect this data history from publicly available records. To have your information removed, we recommend requesting removal directly through your county’s website.
| Date | Status | Borrower | Loan Amount |
|---|---|---|---|
| Open | Glynn Kevin J | $277,000 | |
| Closed | Glynn Kevin J | $119,900 |
Source: Public Records
Tax History
| Year | Tax Paid | Tax Assessment Tax Assessment Total Assessment is a certain percentage of the fair market value that is determined by local assessors to be the total taxable value of land and additions on the property. | Land | Improvement |
|---|---|---|---|---|
| 2025 | $7,060 | $550,300 | $289,200 | $261,100 |
| 2024 | $6,852 | $518,300 | $278,000 | $240,300 |
| 2023 | $6,676 | $480,600 | $241,800 | $238,800 |
| 2022 | $6,293 | $435,200 | $223,900 | $211,300 |
| 2021 | $5,924 | $399,200 | $211,200 | $188,000 |
| 2020 | $5,885 | $392,600 | $199,300 | $193,300 |
| 2019 | $5,693 | $377,000 | $191,600 | $185,400 |
| 2018 | $5,299 | $347,000 | $184,500 | $162,500 |
| 2017 | $5,122 | $334,100 | $177,400 | $156,700 |
| 2016 | $4,858 | $312,200 | $170,500 | $141,700 |
| 2015 | $4,686 | $298,500 | $162,200 | $136,300 |
| 2014 | $4,517 | $286,600 | $162,200 | $124,400 |
Source: Public Records
Map
Nearby Homes
- 16 York Cir
- 269 Bullard St
- 527 Walpole St
- 108 Kendall St
- 7 Lilac Ct
- 0 Charlotte Rd
- 18 Powder House Ln Unit 5
- 16 Powder House Ln Unit 4
- 2301 Pennington Dr Unit 2301
- 5 Powder House Ln Unit 5
- 28 Lancelot Ct
- Unit 4 Powder House Ln Unit 4
- 1108 Pennington Dr Unit 1108
- 68 Old Post Rd
- 70 Endicott St Unit 305
- 7 Haynes St
- 26 Alandale Pkwy
- 90 Walnut St
- 15 Mayflower Rd
- 19 Rainbow Pond Dr Unit B2
Your Personal Tour Guide
Ask me questions while you tour the home.