Estimated Value: $552,000 - $696,000
4
Beds
3
Baths
1,844
Sq Ft
$345/Sq Ft
Est. Value
About This Home
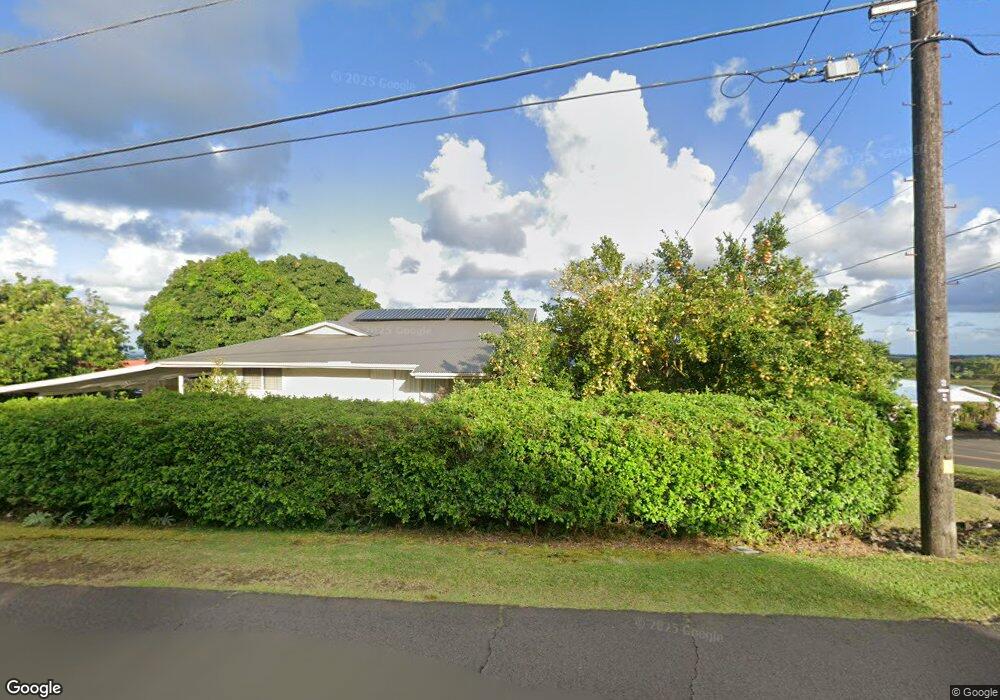
This home is located at 43 Akea St, Hilo, HI 96720 and is currently estimated at $636,739, approximately $345 per square foot. 43 Akea St is a home located in Hawaii County with nearby schools including Waiakeawaena Elementary School, Waiakea Intermediate School, and Waiakea High School.
Ownership History
Date
Name
Owned For
Owner Type
Purchase Details
Closed on
Nov 21, 2012
Sold by
Fujioka Howard T and Fujioka Garrett S
Bought by
Fujioka Howard T and Fujioka Garrett S
Current Estimated Value
Home Financials for this Owner
Home Financials are based on the most recent Mortgage that was taken out on this home.
Original Mortgage
$170,500
Interest Rate
3.33%
Mortgage Type
New Conventional
Purchase Details
Closed on
Aug 13, 2003
Sold by
Fujioka Howard T and Fujioka Garrett S
Bought by
Fujioka Howard T and Fujioka Garrett S
Home Financials for this Owner
Home Financials are based on the most recent Mortgage that was taken out on this home.
Original Mortgage
$110,000
Interest Rate
5.29%
Mortgage Type
Purchase Money Mortgage
Purchase Details
Closed on
Feb 3, 1997
Sold by
Fujioka Howard T
Bought by
Fujioka Garrett S
Create a Home Valuation Report for This Property
The Home Valuation Report is an in-depth analysis detailing your home's value as well as a comparison with similar homes in the area
Home Values in the Area
Average Home Value in this Area
Purchase History
| Date | Buyer | Sale Price | Title Company |
|---|---|---|---|
| Fujioka Howard T | -- | Fam | |
| Fujioka Howard T | -- | -- | |
| Fujioka Garrett S | -- | -- |
Source: Public Records
Mortgage History
| Date | Status | Borrower | Loan Amount |
|---|---|---|---|
| Closed | Fujioka Howard T | $170,500 | |
| Closed | Fujioka Howard T | $110,000 |
Source: Public Records
Tax History
| Year | Tax Paid | Tax Assessment Tax Assessment Total Assessment is a certain percentage of the fair market value that is determined by local assessors to be the total taxable value of land and additions on the property. | Land | Improvement |
|---|---|---|---|---|
| 2025 | $1,284 | $332,200 | $73,100 | $259,100 |
| 2024 | $1,238 | $322,500 | $73,100 | $249,400 |
| 2023 | $1,233 | $313,100 | $73,100 | $240,000 |
| 2022 | $1,250 | $304,000 | $73,100 | $230,900 |
| 2021 | $1,206 | $295,100 | $73,100 | $222,000 |
| 2020 | $795 | $286,500 | $73,100 | $213,400 |
| 2019 | $754 | $556,400 | $146,200 | $410,200 |
| 2018 | $714 | $270,100 | $73,100 | $197,000 |
| 2017 | $675 | $262,200 | $73,100 | $189,100 |
| 2016 | $638 | $254,600 | $73,100 | $181,500 |
| 2015 | $531 | $247,200 | $73,100 | $174,100 |
| 2014 | $531 | $240,000 | $73,100 | $166,900 |
Source: Public Records
Map
Nearby Homes
- 39 Laula Rd
- 29 Laula Rd
- 508 Ekela St
- 3047 Lou St
- 121 Malia St
- 450 Pohakulani St
- 110 Malia St
- 595 W Kawailani St
- 2615 Kinoole St
- 2557 Kinoole St
- 91 Hoomalu St
- 2501 Kinoole St
- 0 Ainalako Rd
- 1588 Mailani St
- 347 Nohea St
- 2669 Kilauea Ave
- 89 W Kawailani St
- 2244 Kinoole St
- 420 Ainalako Rd
- 2501 Kilauea Ave
Your Personal Tour Guide
Ask me questions while you tour the home.