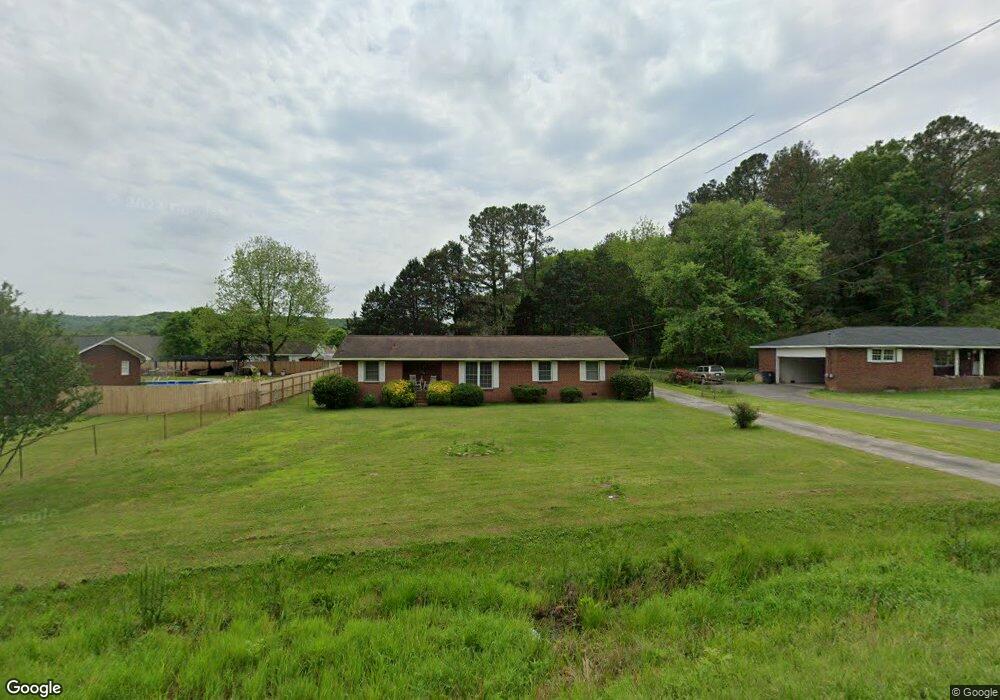
43 Alabama St Cave Spring, GA 30124
Estimated Value: $179,190 - $222,000
--
Bed
1
Bath
1,628
Sq Ft
$125/Sq Ft
Est. Value
About This Home
This home is located at 43 Alabama St, Cave Spring, GA 30124 and is currently estimated at $203,298, approximately $124 per square foot. 43 Alabama St is a home located in Floyd County with nearby schools including Coosa Middle School and Coosa High School.
Ownership History
Date
Name
Owned For
Owner Type
Purchase Details
Closed on
Nov 10, 2023
Sold by
Jones Anthony Tim
Bought by
Anthony Ginger Ann and Anthony Timothy Jones
Current Estimated Value
Purchase Details
Closed on
Mar 10, 2011
Sold by
Dobbs Anthony Blanche and Ant James Landon
Bought by
Anthony Blanche Dobbs Anth
Purchase Details
Closed on
May 18, 2010
Sold by
Anthony Jones Clifford and Anthony Blanche Dobbs
Bought by
Dobbs Anthony Blanche and Ant James Landon
Purchase Details
Closed on
May 26, 2009
Sold by
Anthony Jones C
Bought by
Anthony Timothy Jones
Purchase Details
Closed on
Jun 23, 1969
Sold by
Shumate Sammy Gene and Shumate Glenda P
Bought by
Anthony Jones C and Anthony Blanche D
Purchase Details
Closed on
Dec 9, 1967
Sold by
Mason Dennis E Gayle T Godfrey and Mason Hugh D
Bought by
Shumate Sammy Gene and Shumate Glenda P
Purchase Details
Closed on
Apr 24, 1967
Sold by
Wright Lewis
Bought by
Mason Dennis E Gayle T Godfrey and Mason Hu
Purchase Details
Closed on
Jan 1, 1962
Bought by
Wright Lewis
Create a Home Valuation Report for This Property
The Home Valuation Report is an in-depth analysis detailing your home's value as well as a comparison with similar homes in the area
Home Values in the Area
Average Home Value in this Area
Purchase History
| Date | Buyer | Sale Price | Title Company |
|---|---|---|---|
| Anthony Ginger Ann | -- | -- | |
| Anthony Blanche Dobbs Anth | -- | -- | |
| Dobbs Anthony Blanche | -- | -- | |
| Anthony Timothy Jones | -- | -- | |
| Anthony Jones C | $4,000 | -- | |
| Shumate Sammy Gene | -- | -- | |
| Mason Dennis E Gayle T Godfrey | $2,100 | -- | |
| Wright Lewis | -- | -- |
Source: Public Records
Tax History Compared to Growth
Tax History
| Year | Tax Paid | Tax Assessment Tax Assessment Total Assessment is a certain percentage of the fair market value that is determined by local assessors to be the total taxable value of land and additions on the property. | Land | Improvement |
|---|---|---|---|---|
| 2024 | $1,752 | $60,481 | $9,200 | $51,281 |
| 2023 | $1,591 | $58,852 | $8,364 | $50,488 |
| 2022 | $1,261 | $46,088 | $6,834 | $39,254 |
| 2021 | $1,107 | $39,706 | $6,228 | $33,478 |
| 2020 | $1,032 | $36,673 | $5,415 | $31,258 |
| 2019 | $213 | $34,453 | $5,415 | $29,038 |
| 2018 | $222 | $32,832 | $5,158 | $27,674 |
| 2017 | $223 | $31,564 | $4,776 | $26,788 |
| 2016 | $217 | $30,883 | $4,760 | $26,123 |
| 2015 | $199 | $30,883 | $4,760 | $26,123 |
| 2014 | $199 | $30,883 | $4,760 | $26,123 |
Source: Public Records
Map
Nearby Homes
- 5677 Fosters Mill Rd SW
- 7 Herschel Mize Dr SW
- 7 Herschel Mize Dr
- 5598 Fosters Mill Rd
- 22 River St SW
- 57 Mill St
- 104 Fincher St
- 0 Mill Rd Unit 10629874
- 0 Mill Rd Unit 7670319
- 0 Melson Rd SW Unit 7676052
- 0 Melson Rd SW Unit 10636997
- 8876 Cave Spring Rd SW
- 10 Ridge Rd SW
- 907 Gadsden Rd SW
- 8876 Cave Spring
- 123 Santa Claus Rd
- 2053 Buttermilk Rd SW
- 0 McGee Bend Rd SW Unit 10351960
- 424 Michael Blvd
- 383 Valley Grove Rd