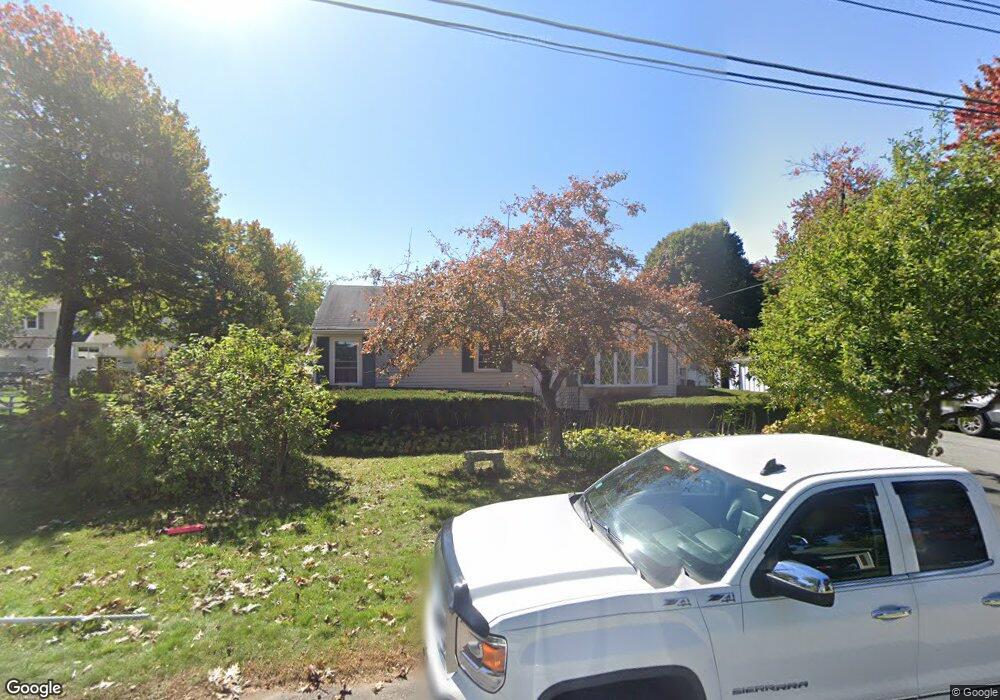
43 Alice Ave Fitchburg, MA 01420
Estimated Value: $386,000 - $410,000
2
Beds
1
Bath
1,014
Sq Ft
$391/Sq Ft
Est. Value
About This Home
This home is located at 43 Alice Ave, Fitchburg, MA 01420 and is currently estimated at $396,541, approximately $391 per square foot. 43 Alice Ave is a home located in Worcester County with nearby schools including Reingold Elementary School, South Street Elementary School, and Crocker Elementary School.
Ownership History
Date
Name
Owned For
Owner Type
Purchase Details
Closed on
Sep 30, 2025
Sold by
Fausta Tafuri Irt and Tafuri
Bought by
Morcaldi Jared J
Current Estimated Value
Home Financials for this Owner
Home Financials are based on the most recent Mortgage that was taken out on this home.
Original Mortgage
$299,730
Outstanding Balance
$299,730
Interest Rate
6.58%
Mortgage Type
New Conventional
Estimated Equity
$96,811
Purchase Details
Closed on
Aug 7, 2009
Sold by
Tafuri Sabino and Tafuri Fausta
Bought by
Fausta Tafuri Irt and Tafuri
Create a Home Valuation Report for This Property
The Home Valuation Report is an in-depth analysis detailing your home's value as well as a comparison with similar homes in the area
Home Values in the Area
Average Home Value in this Area
Purchase History
| Date | Buyer | Sale Price | Title Company |
|---|---|---|---|
| Morcaldi Jared J | $309,000 | -- | |
| Fausta Tafuri Irt | -- | -- | |
| Fausta Tafuri Irt | -- | -- |
Source: Public Records
Mortgage History
| Date | Status | Borrower | Loan Amount |
|---|---|---|---|
| Open | Morcaldi Jared J | $299,730 |
Source: Public Records
Tax History Compared to Growth
Tax History
| Year | Tax Paid | Tax Assessment Tax Assessment Total Assessment is a certain percentage of the fair market value that is determined by local assessors to be the total taxable value of land and additions on the property. | Land | Improvement |
|---|---|---|---|---|
| 2025 | $43 | $316,900 | $114,400 | $202,500 |
| 2024 | $4,141 | $279,600 | $81,700 | $197,900 |
| 2023 | $4,098 | $255,800 | $72,900 | $182,900 |
| 2022 | $3,843 | $218,200 | $71,700 | $146,500 |
| 2021 | $3,829 | $201,200 | $69,200 | $132,000 |
| 2020 | $3,749 | $190,200 | $67,900 | $122,300 |
| 2019 | $3,489 | $170,300 | $69,200 | $101,100 |
| 2018 | $3,280 | $156,100 | $64,100 | $92,000 |
| 2017 | $3,234 | $150,500 | $62,900 | $87,600 |
| 2016 | $3,040 | $143,200 | $57,800 | $85,400 |
| 2015 | $2,881 | $139,300 | $55,300 | $84,000 |
| 2014 | $2,762 | $139,300 | $55,300 | $84,000 |
Source: Public Records
Map
Nearby Homes
- 53 Alice Ave
- 41 Lee Ave
- 16 Quarter Horse Ln Unit 59AA
- 5 Quarter Horse Ln Unit 5
- 126 Saddlebred Rd Unit 63BB
- 521 Rollstone Rd
- 44 Bel Air Dr
- 83 Eleanor St
- 34 Oak Leaf Rd
- 515 Mount Elam Rd
- 465 Franklin Rd
- 35 Bernadette St
- 162 Delisle St
- 0 Franklin Rd-Lots1-7 Unit 72947330
- 36 England Ave
- 27 Clifton St
- 559 Milk St
- 32 Clifton St
- 48 Woodworth Ave
- 20 Silver St