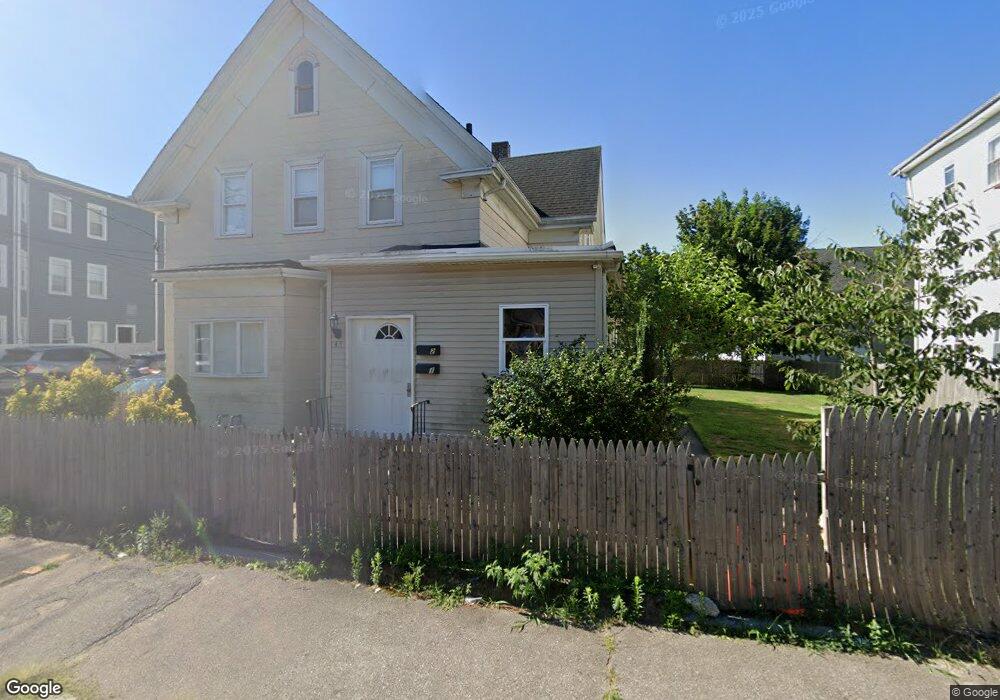
43 Allen St Brockton, MA 02301
Clifton Heights NeighborhoodEstimated Value: $604,551 - $756,000
4
Beds
2
Baths
1,923
Sq Ft
$356/Sq Ft
Est. Value
About This Home
This home is located at 43 Allen St, Brockton, MA 02301 and is currently estimated at $684,388, approximately $355 per square foot. 43 Allen St is a home located in Plymouth County with nearby schools including Arnone Elementary School, Joseph F. Plouffe Middle School, and Trinity Catholic Academy.
Ownership History
Date
Name
Owned For
Owner Type
Purchase Details
Closed on
Jul 21, 2020
Sold by
Monteiro Tony and Monteiro Maria
Bought by
Monteiro Joshua T
Current Estimated Value
Home Financials for this Owner
Home Financials are based on the most recent Mortgage that was taken out on this home.
Original Mortgage
$369,600
Outstanding Balance
$328,345
Interest Rate
3.2%
Mortgage Type
New Conventional
Estimated Equity
$356,043
Purchase Details
Closed on
Jun 22, 1990
Sold by
Pina Carl
Bought by
Monteiro Tony
Home Financials for this Owner
Home Financials are based on the most recent Mortgage that was taken out on this home.
Original Mortgage
$125,900
Interest Rate
10.39%
Mortgage Type
Purchase Money Mortgage
Create a Home Valuation Report for This Property
The Home Valuation Report is an in-depth analysis detailing your home's value as well as a comparison with similar homes in the area
Home Values in the Area
Average Home Value in this Area
Purchase History
| Date | Buyer | Sale Price | Title Company |
|---|---|---|---|
| Monteiro Joshua T | $462,000 | Platinum Title Services | |
| Monteiro Tony | $139,900 | -- |
Source: Public Records
Mortgage History
| Date | Status | Borrower | Loan Amount |
|---|---|---|---|
| Open | Monteiro Joshua T | $369,600 | |
| Previous Owner | Monteiro Tony | $239,000 | |
| Previous Owner | Monteiro Tony | $195,000 | |
| Previous Owner | Monteiro Tony | $125,900 |
Source: Public Records
Tax History Compared to Growth
Tax History
| Year | Tax Paid | Tax Assessment Tax Assessment Total Assessment is a certain percentage of the fair market value that is determined by local assessors to be the total taxable value of land and additions on the property. | Land | Improvement |
|---|---|---|---|---|
| 2025 | $6,515 | $538,000 | $140,100 | $397,900 |
| 2024 | $6,425 | $534,500 | $140,100 | $394,400 |
| 2023 | $6,548 | $504,500 | $104,300 | $400,200 |
| 2022 | $6,504 | $465,600 | $94,900 | $370,700 |
| 2021 | $5,697 | $392,900 | $78,800 | $314,100 |
| 2020 | $5,000 | $330,000 | $73,800 | $256,200 |
| 2019 | $4,331 | $278,700 | $72,000 | $206,700 |
| 2018 | $4,300 | $272,700 | $72,000 | $200,700 |
| 2017 | $3,877 | $240,800 | $72,000 | $168,800 |
| 2016 | $3,797 | $218,700 | $69,800 | $148,900 |
| 2015 | $3,494 | $192,500 | $69,800 | $122,700 |
| 2014 | $3,363 | $185,500 | $69,800 | $115,700 |
Source: Public Records
Map
Nearby Homes
- 25 Somerset Place
- 14 Cottage St
- 16 Otis St
- 0 W Park St
- 17 Foster St Unit 21
- 55 Fuller St
- 14 Track St
- 65 Forest Ave
- 16 Hancock St
- 29 Hancock St
- 147 Centre St Unit 603
- 147 Centre St Unit 201
- 59 S Fuller St
- 38 Howard Square
- 78 Summer St
- 58 Hunt St
- 108 Newbury St
- 203 W Elm St
- 22 Bates St
- 208 Winthrop St
- 47 Allen St
- 47 Allen St Unit 3
- 47 Allen St Unit 2
- 47 Allen St Unit 1
- 39 Allen St Unit 3
- 37 Allen St Unit 1
- 39 Allen St Unit 2
- 39 Allen St
- 39 Allen St Unit 1
- 37 Allen St
- 49 Allen St
- 17 Ridgeway Ct
- 23 Ridgeway Ct Unit 3
- 25 Ridgeway Ct
- 23 Ridgeway Ct
- 23 Ridgeway Ct Unit 23
- 25 Ridgeway Ct Unit 25
- 25 Ridgeway Ct Unit 4
- 9 Ridgeway Ct
- 29 Allen St