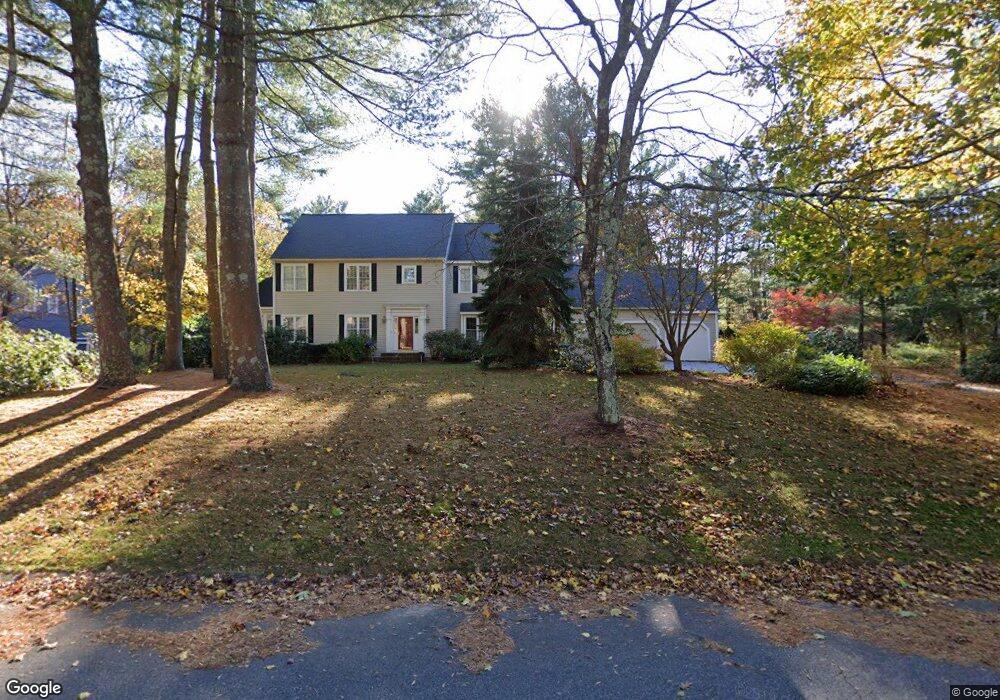
43 Atkinson Ln Sudbury, MA 01776
Estimated Value: $1,428,000 - $1,657,000
4
Beds
3
Baths
3,500
Sq Ft
$438/Sq Ft
Est. Value
About This Home
This home is located at 43 Atkinson Ln, Sudbury, MA 01776 and is currently estimated at $1,531,756, approximately $437 per square foot. 43 Atkinson Ln is a home located in Middlesex County with nearby schools including Peter Noyes Elementary School, Ephraim Curtis Middle School, and Lincoln-Sudbury Regional High School.
Ownership History
Date
Name
Owned For
Owner Type
Purchase Details
Closed on
Sep 30, 2003
Sold by
Schiavi Douglas J and Schiavi Nell M
Bought by
Doh Cha P and Pan Joanna J
Current Estimated Value
Home Financials for this Owner
Home Financials are based on the most recent Mortgage that was taken out on this home.
Original Mortgage
$300,000
Outstanding Balance
$140,766
Interest Rate
6.29%
Mortgage Type
Purchase Money Mortgage
Estimated Equity
$1,390,990
Create a Home Valuation Report for This Property
The Home Valuation Report is an in-depth analysis detailing your home's value as well as a comparison with similar homes in the area
Home Values in the Area
Average Home Value in this Area
Purchase History
| Date | Buyer | Sale Price | Title Company |
|---|---|---|---|
| Doh Cha P | $847,500 | -- |
Source: Public Records
Mortgage History
| Date | Status | Borrower | Loan Amount |
|---|---|---|---|
| Open | Doh Cha P | $300,000 |
Source: Public Records
Tax History Compared to Growth
Tax History
| Year | Tax Paid | Tax Assessment Tax Assessment Total Assessment is a certain percentage of the fair market value that is determined by local assessors to be the total taxable value of land and additions on the property. | Land | Improvement |
|---|---|---|---|---|
| 2025 | $19,577 | $1,337,200 | $550,600 | $786,600 |
| 2024 | $18,841 | $1,289,600 | $534,600 | $755,000 |
| 2023 | $17,514 | $1,110,600 | $477,800 | $632,800 |
| 2022 | $17,256 | $956,000 | $438,600 | $517,400 |
| 2021 | $16,467 | $874,500 | $438,600 | $435,900 |
| 2020 | $16,061 | $870,500 | $438,600 | $431,900 |
| 2019 | $15,591 | $870,500 | $438,600 | $431,900 |
| 2018 | $15,440 | $861,100 | $466,200 | $394,900 |
| 2017 | $15,132 | $853,000 | $461,800 | $391,200 |
| 2016 | $14,671 | $824,200 | $444,200 | $380,000 |
| 2015 | $14,305 | $812,800 | $440,200 | $372,600 |
| 2014 | $14,312 | $793,800 | $428,600 | $365,200 |
Source: Public Records
Map
Nearby Homes
- 47 Fairbank Rd
- 4 Elderberry Cir
- 12 Camperdown Ln
- 21 Summer St
- 36 Old Forge Ln
- 14 Tanbark Rd
- 54 Phillips Rd
- 24 Goodnow Rd
- 7 Saddle Ridge Rd
- 55 Widow Rites Ln
- 45 Widow Rites Ln
- 166 Parker St Unit 4
- 30 Rolling Ln
- 67 Old Marlboro Rd
- 270 Old Lancaster Rd
- 143 Peakham Rd
- 5 Taintor Dr
- 25 Bridle Path
- 89 Bridle Path
- 63 Canterbury Dr