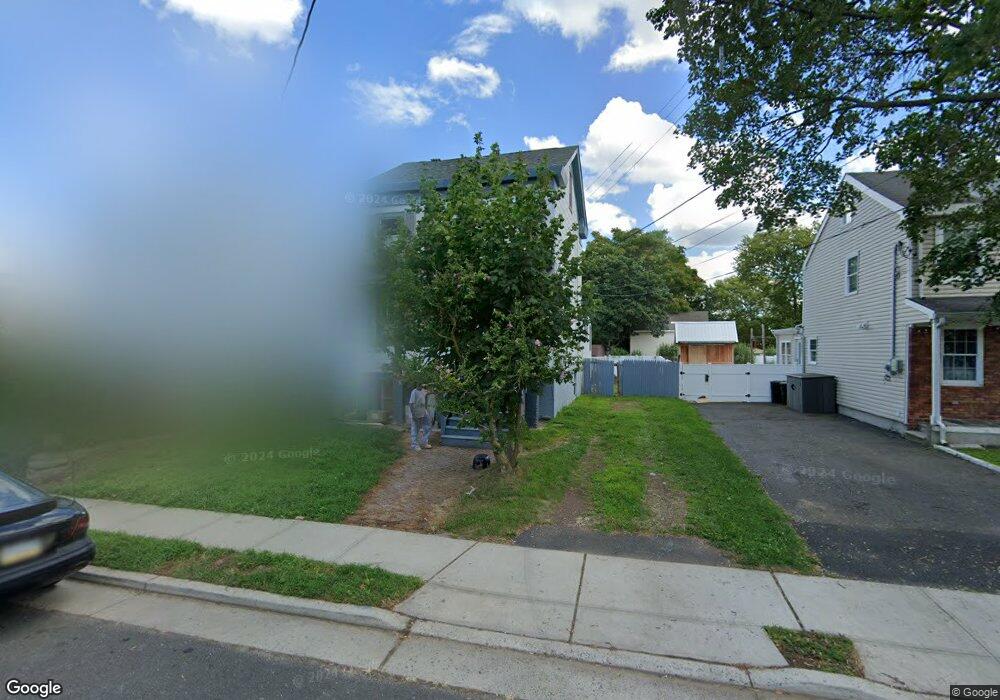
43 Atlantic St Keyport, NJ 07735
Estimated Value: $575,000 - $603,000
3
Beds
3
Baths
1,515
Sq Ft
$389/Sq Ft
Est. Value
About This Home
This home is located at 43 Atlantic St, Keyport, NJ 07735 and is currently estimated at $588,670, approximately $388 per square foot. 43 Atlantic St is a home located in Monmouth County with nearby schools including Keyport Central School, Keyport High School, and Icob Academy.
Ownership History
Date
Name
Owned For
Owner Type
Purchase Details
Closed on
Nov 8, 2019
Sold by
Kilic Hidayet
Bought by
Ziemba Stacey
Current Estimated Value
Home Financials for this Owner
Home Financials are based on the most recent Mortgage that was taken out on this home.
Original Mortgage
$363,298
Outstanding Balance
$324,501
Interest Rate
4.4%
Mortgage Type
FHA
Estimated Equity
$264,169
Purchase Details
Closed on
Mar 22, 2018
Sold by
Yurowski Eric Michael
Bought by
Kilic Hidayet
Create a Home Valuation Report for This Property
The Home Valuation Report is an in-depth analysis detailing your home's value as well as a comparison with similar homes in the area
Home Values in the Area
Average Home Value in this Area
Purchase History
| Date | Buyer | Sale Price | Title Company |
|---|---|---|---|
| Ziemba Stacey | $370,000 | Vintage Title Services Llc | |
| Kilic Hidayet | $101,000 | None Available |
Source: Public Records
Mortgage History
| Date | Status | Borrower | Loan Amount |
|---|---|---|---|
| Open | Ziemba Stacey | $363,298 |
Source: Public Records
Tax History Compared to Growth
Tax History
| Year | Tax Paid | Tax Assessment Tax Assessment Total Assessment is a certain percentage of the fair market value that is determined by local assessors to be the total taxable value of land and additions on the property. | Land | Improvement |
|---|---|---|---|---|
| 2025 | $10,911 | $572,300 | $185,700 | $386,600 |
| 2024 | $10,691 | $527,100 | $159,500 | $367,600 |
| 2023 | $10,691 | $486,400 | $145,000 | $341,400 |
| 2022 | $9,352 | $422,800 | $126,100 | $296,700 |
| 2021 | $9,352 | $371,100 | $116,700 | $254,400 |
| 2020 | $6,324 | $248,700 | $112,000 | $136,700 |
| 2019 | $6,122 | $241,100 | $107,500 | $133,600 |
| 2018 | $6,211 | $238,900 | $113,900 | $125,000 |
| 2017 | $6,072 | $232,900 | $109,400 | $123,500 |
| 2016 | $6,188 | $239,400 | $109,400 | $130,000 |
| 2015 | $5,822 | $224,200 | $95,900 | $128,300 |
| 2014 | $5,779 | $224,700 | $73,400 | $151,300 |
Source: Public Records
Map
Nearby Homes