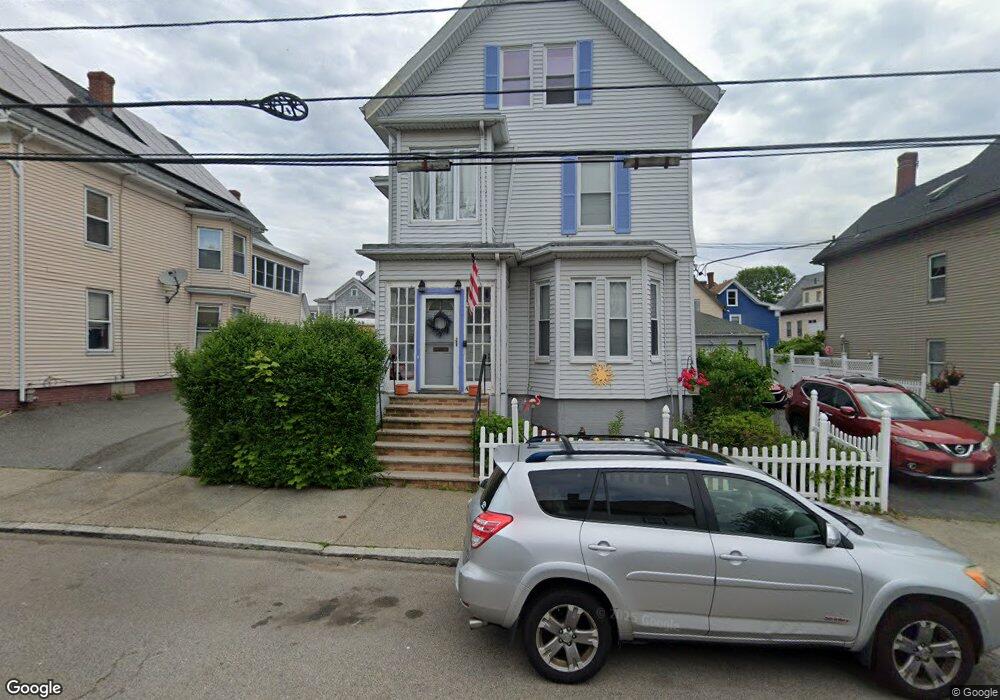
43 Autumn St Lynn, MA 01902
Diamond District NeighborhoodEstimated Value: $752,135 - $872,000
4
Beds
2
Baths
3,096
Sq Ft
$262/Sq Ft
Est. Value
About This Home
This home is located at 43 Autumn St, Lynn, MA 01902 and is currently estimated at $812,534, approximately $262 per square foot. 43 Autumn St is a home located in Essex County with nearby schools including Brickett Elementary School, William R. Fallon School, and Marshall Middle School.
Ownership History
Date
Name
Owned For
Owner Type
Purchase Details
Closed on
Mar 26, 2014
Sold by
Crawford Matthew
Bought by
Crawford Matthew and Richards Thomasina A
Current Estimated Value
Home Financials for this Owner
Home Financials are based on the most recent Mortgage that was taken out on this home.
Original Mortgage
$510,000
Outstanding Balance
$500,356
Interest Rate
4.27%
Mortgage Type
Reverse Mortgage Home Equity Conversion Mortgage
Estimated Equity
$312,178
Purchase Details
Closed on
Feb 10, 1998
Sold by
Ward Charles
Bought by
Crawford Matthew
Purchase Details
Closed on
Jul 27, 1995
Sold by
Feldman Earl and Feldman Leo
Bought by
Crawford Matthew and Ward Charles
Create a Home Valuation Report for This Property
The Home Valuation Report is an in-depth analysis detailing your home's value as well as a comparison with similar homes in the area
Home Values in the Area
Average Home Value in this Area
Purchase History
| Date | Buyer | Sale Price | Title Company |
|---|---|---|---|
| Crawford Matthew | -- | -- | |
| Crawford Matthew | -- | -- | |
| Crawford Matthew | -- | -- | |
| Crawford Matthew | $13,500 | -- | |
| Crawford Matthew | $13,500 | -- | |
| Crawford Matthew | $95,000 | -- | |
| Crawford Matthew | $95,000 | -- |
Source: Public Records
Mortgage History
| Date | Status | Borrower | Loan Amount |
|---|---|---|---|
| Open | Crawford Matthew | $510,000 | |
| Closed | Crawford Matthew | $510,000 |
Source: Public Records
Tax History Compared to Growth
Tax History
| Year | Tax Paid | Tax Assessment Tax Assessment Total Assessment is a certain percentage of the fair market value that is determined by local assessors to be the total taxable value of land and additions on the property. | Land | Improvement |
|---|---|---|---|---|
| 2025 | $7,874 | $760,064 | $192,900 | $567,164 |
| 2024 | $7,477 | $710,100 | $184,500 | $525,600 |
| 2023 | $7,654 | $686,500 | $197,300 | $489,200 |
| 2022 | $7,566 | $608,700 | $154,100 | $454,600 |
| 2021 | $6,931 | $531,900 | $126,300 | $405,600 |
| 2020 | $6,585 | $491,400 | $129,800 | $361,600 |
| 2019 | $6,082 | $425,300 | $100,200 | $325,100 |
| 2018 | $5,874 | $387,700 | $112,600 | $275,100 |
| 2017 | $5,711 | $366,100 | $98,900 | $267,200 |
| 2016 | $5,171 | $319,600 | $82,600 | $237,000 |
| 2015 | $5,002 | $298,600 | $87,400 | $211,200 |
Source: Public Records
Map
Nearby Homes
- 7 Sidney Ave
- 42 Basset St
- 38 Cherry St Unit 1
- 24 Parrott St
- 46 Wardwell Ave
- 38 Chestnut St
- 2 Peirce Rd
- 26 Groveland St
- 129 Williams Ave
- 13 Portland St Unit 4
- 248 Essex St
- 175 Essex St
- 35 Columbia Ave
- 14-16 Dexter St
- 133 Eastern Ave Unit 8
- 7-9 Rock Ave
- 285 Lynn Shore Dr Unit 308
- 285 Lynn Shore Dr Unit 508
- 285 Lynn Shore Dr Unit 203
- 13 Nahant St Unit 2D