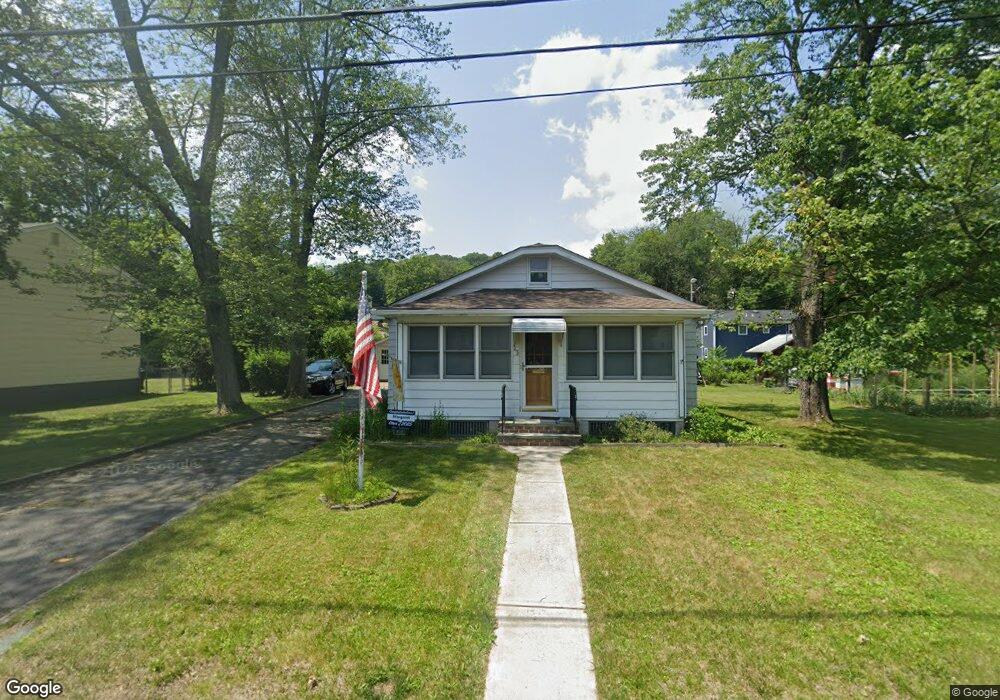
43 Bailey Ave Bloomingdale, NJ 07403
Estimated Value: $453,778 - $505,000
--
Bed
--
Bath
1,008
Sq Ft
$477/Sq Ft
Est. Value
About This Home
This home is located at 43 Bailey Ave, Bloomingdale, NJ 07403 and is currently estimated at $480,945, approximately $477 per square foot. 43 Bailey Ave is a home located in Passaic County with nearby schools including Samuel R. Donald School, Martha B. Day School, and Walter T. Bergen Middle School.
Ownership History
Date
Name
Owned For
Owner Type
Purchase Details
Closed on
Sep 19, 2000
Sold by
Gomez Joseph
Bought by
Mascitello Michael and Mascitello Meredith
Current Estimated Value
Home Financials for this Owner
Home Financials are based on the most recent Mortgage that was taken out on this home.
Original Mortgage
$149,500
Outstanding Balance
$53,444
Interest Rate
7.83%
Estimated Equity
$427,501
Purchase Details
Closed on
Feb 2, 2000
Sold by
Jobes Lawrence H
Bought by
Gomez Joseph
Create a Home Valuation Report for This Property
The Home Valuation Report is an in-depth analysis detailing your home's value as well as a comparison with similar homes in the area
Home Values in the Area
Average Home Value in this Area
Purchase History
| Date | Buyer | Sale Price | Title Company |
|---|---|---|---|
| Mascitello Michael | $161,500 | Chicago Title Insurance Co | |
| Gomez Joseph | $125,000 | -- |
Source: Public Records
Mortgage History
| Date | Status | Borrower | Loan Amount |
|---|---|---|---|
| Open | Mascitello Michael | $149,500 |
Source: Public Records
Tax History Compared to Growth
Tax History
| Year | Tax Paid | Tax Assessment Tax Assessment Total Assessment is a certain percentage of the fair market value that is determined by local assessors to be the total taxable value of land and additions on the property. | Land | Improvement |
|---|---|---|---|---|
| 2025 | $9,188 | $200,300 | $119,300 | $81,000 |
| 2024 | $9,018 | $200,300 | $119,300 | $81,000 |
| 2022 | $8,795 | $200,300 | $119,300 | $81,000 |
| 2021 | $8,809 | $200,300 | $119,300 | $81,000 |
| 2020 | $8,737 | $200,300 | $119,300 | $81,000 |
| 2019 | $8,649 | $200,300 | $119,300 | $81,000 |
| 2018 | $8,603 | $200,300 | $119,300 | $81,000 |
| 2017 | $8,441 | $200,300 | $119,300 | $81,000 |
| 2016 | $8,322 | $200,300 | $119,300 | $81,000 |
| 2015 | $8,120 | $200,300 | $119,300 | $81,000 |
| 2014 | $7,822 | $200,300 | $119,300 | $81,000 |
Source: Public Records
Map
Nearby Homes