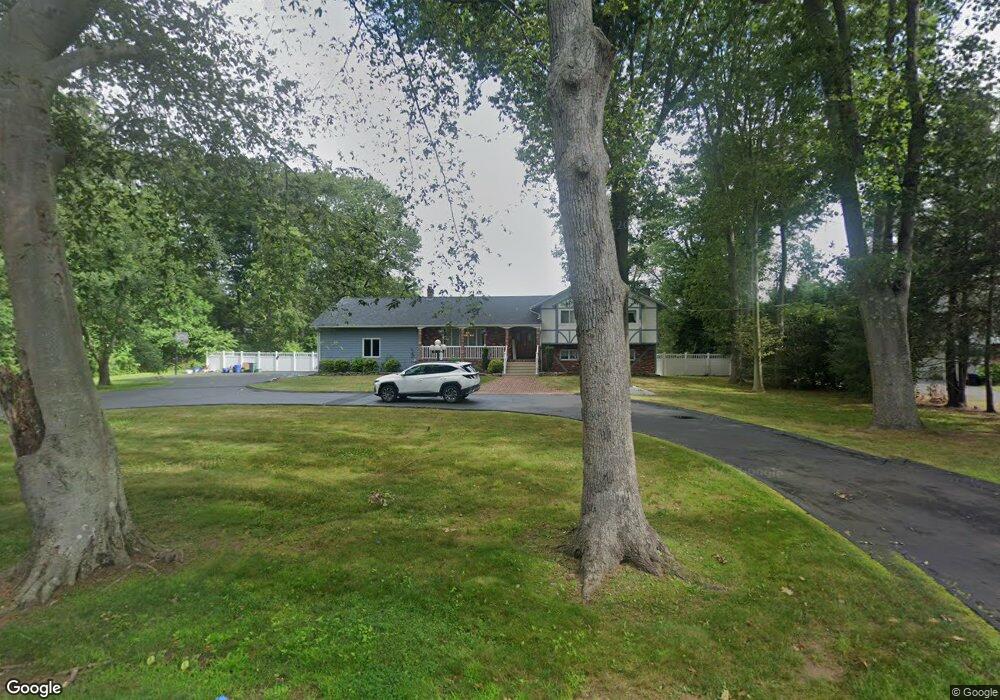
43 Beach Ln North Haven, CT 06473
Estimated Value: $568,000 - $628,000
4
Beds
3
Baths
1,914
Sq Ft
$313/Sq Ft
Est. Value
About This Home
This home is located at 43 Beach Ln, North Haven, CT 06473 and is currently estimated at $599,895, approximately $313 per square foot. 43 Beach Ln is a home located in New Haven County with nearby schools including North Haven Middle School and North Haven High School.
Ownership History
Date
Name
Owned For
Owner Type
Purchase Details
Closed on
Dec 14, 2022
Sold by
Vollero Kristin A
Bought by
Vollero Salvatore L and Vollero Kristin A
Current Estimated Value
Purchase Details
Closed on
Dec 13, 2016
Sold by
Vollero Kristin A and Toscano Santa E
Bought by
Vollero Kristin
Purchase Details
Closed on
Mar 1, 2010
Sold by
Fnma
Bought by
Vollero Kristin A and Toscano Santa E
Home Financials for this Owner
Home Financials are based on the most recent Mortgage that was taken out on this home.
Original Mortgage
$289,656
Interest Rate
5.11%
Mortgage Type
Purchase Money Mortgage
Purchase Details
Closed on
Nov 3, 2009
Sold by
Wells Fargo Bank Na
Bought by
Federal National Mortgage Association
Purchase Details
Closed on
Nov 7, 2000
Sold by
Dattilo Michael R and Dattilo Karen M
Bought by
Knight Kyle and Knight Jessica
Create a Home Valuation Report for This Property
The Home Valuation Report is an in-depth analysis detailing your home's value as well as a comparison with similar homes in the area
Home Values in the Area
Average Home Value in this Area
Purchase History
| Date | Buyer | Sale Price | Title Company |
|---|---|---|---|
| Vollero Salvatore L | -- | None Available | |
| Vollero Kristin | -- | -- | |
| Vollero Kristin A | $295,000 | -- | |
| Federal National Mortgage Association | -- | -- | |
| Wells Fargo Bank Na | -- | -- | |
| Knight Kyle | $379,000 | -- |
Source: Public Records
Mortgage History
| Date | Status | Borrower | Loan Amount |
|---|---|---|---|
| Previous Owner | Knight Kyle | $313,000 | |
| Previous Owner | Knight Kyle | $289,656 |
Source: Public Records
Tax History
| Year | Tax Paid | Tax Assessment Tax Assessment Total Assessment is a certain percentage of the fair market value that is determined by local assessors to be the total taxable value of land and additions on the property. | Land | Improvement |
|---|---|---|---|---|
| 2025 | $10,697 | $363,090 | $92,820 | $270,270 |
| 2024 | $9,463 | $273,190 | $92,830 | $180,360 |
| 2023 | $8,920 | $273,190 | $92,830 | $180,360 |
| 2022 | $8,390 | $273,190 | $92,830 | $180,360 |
| 2021 | $8,390 | $273,190 | $92,830 | $180,360 |
| 2020 | $8,392 | $273,190 | $92,830 | $180,360 |
| 2019 | $8,894 | $285,250 | $91,700 | $193,550 |
| 2018 | $52,292 | $285,250 | $91,700 | $193,550 |
| 2017 | $50,912 | $285,250 | $91,700 | $193,550 |
| 2016 | $8,709 | $285,250 | $91,700 | $193,550 |
| 2015 | $8,392 | $285,250 | $91,700 | $193,550 |
| 2014 | $8,055 | $286,650 | $100,100 | $186,550 |
Source: Public Records
Map
Nearby Homes
- 32 Justine Dr
- 28 Sugar Hill Rd
- 384 Middletown Ave
- 334 Middletown Ave
- 146 Fitch St
- 22 Lombard Cir Unit 8
- 20 Lombard Cir Unit 7
- 471 Quinnipiac Ave
- 349 Quinnipiac Ave
- 237 Warner Rd
- 10 Hemingway Rd
- 38 Pine River Rd
- 63 Sackett Point Rd
- 137 Mulholland Way Unit 83
- 9 Birch Ln Unit K
- 6 Waterbury Rd
- 13 Cedar Ct Unit E
- 15 Cedar Ct Unit G
- 18 Kristen Ct
- 75 Redwood Dr Unit 609
- 49 Beach Ln
- 33 Beach Ln
- 27 Green Field Ln
- 32 Green Field Ln
- 23 Green Field Ln
- 55 Beach Ln
- 27 Beach Ln
- 30 Green Field Ln
- 142 N Hill Rd
- 19 Green Field Ln
- 28 Green Field Ln
- 22 Green Field Ln
- 19 Beach Ln
- 15 Green Field Ln
- 26 Green Field Ln
- 161 N Hill Rd
- 5 Barway Rd
- 138 N Hill Rd
- 157 N Hill Rd
- 11 Green Field Ln
Your Personal Tour Guide
Ask me questions while you tour the home.