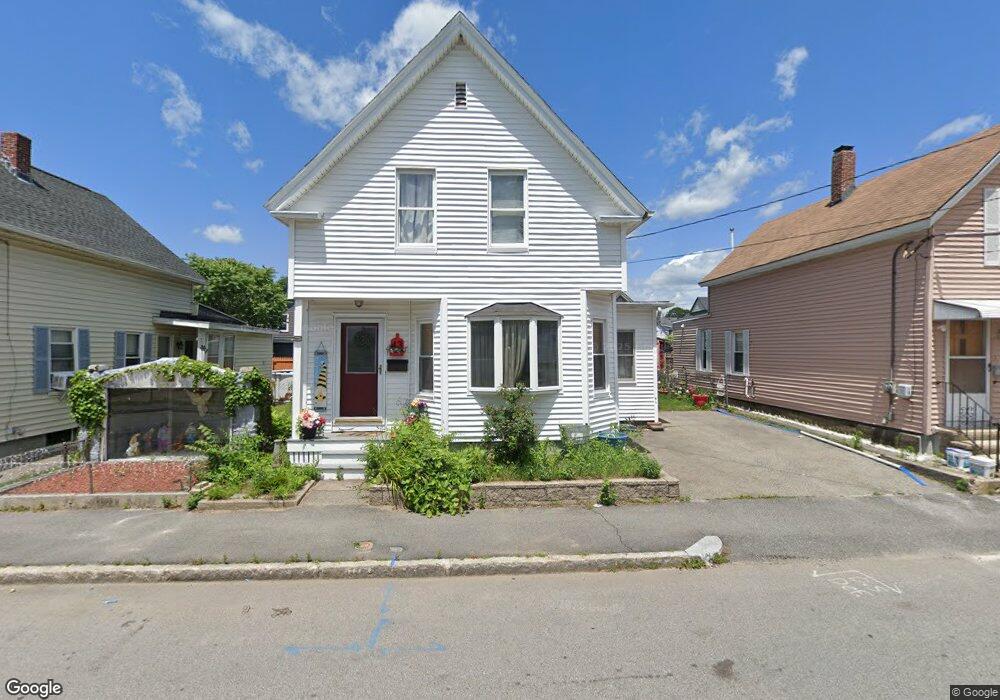
43 Beaver St Lowell, MA 01850
Centralville NeighborhoodEstimated Value: $418,499 - $441,000
3
Beds
1
Bath
1,357
Sq Ft
$316/Sq Ft
Est. Value
About This Home
This home is located at 43 Beaver St, Lowell, MA 01850 and is currently estimated at $428,625, approximately $315 per square foot. 43 Beaver St is a home located in Middlesex County with nearby schools including Greenhalge Elementary School, S. Christa McAuliffe Elementary School, and Moody Elementary School.
Ownership History
Date
Name
Owned For
Owner Type
Purchase Details
Closed on
May 29, 1998
Sold by
Dionne Michael P
Bought by
Page David and Page Marcia L
Current Estimated Value
Home Financials for this Owner
Home Financials are based on the most recent Mortgage that was taken out on this home.
Original Mortgage
$98,900
Interest Rate
7.12%
Mortgage Type
Purchase Money Mortgage
Purchase Details
Closed on
Feb 9, 1998
Sold by
Mcneil Rollande B and Brunelle Gloria T
Bought by
Dionne Michael P
Home Financials for this Owner
Home Financials are based on the most recent Mortgage that was taken out on this home.
Original Mortgage
$51,250
Interest Rate
6.95%
Mortgage Type
Purchase Money Mortgage
Create a Home Valuation Report for This Property
The Home Valuation Report is an in-depth analysis detailing your home's value as well as a comparison with similar homes in the area
Home Values in the Area
Average Home Value in this Area
Purchase History
| Date | Buyer | Sale Price | Title Company |
|---|---|---|---|
| Page David | $102,000 | -- | |
| Page David | $102,000 | -- | |
| Dionne Michael P | $57,500 | -- | |
| Dionne Michael P | $57,500 | -- |
Source: Public Records
Mortgage History
| Date | Status | Borrower | Loan Amount |
|---|---|---|---|
| Open | Dionne Michael P | $125,000 | |
| Closed | Dionne Michael P | $98,900 | |
| Previous Owner | Dionne Michael P | $51,250 |
Source: Public Records
Tax History Compared to Growth
Tax History
| Year | Tax Paid | Tax Assessment Tax Assessment Total Assessment is a certain percentage of the fair market value that is determined by local assessors to be the total taxable value of land and additions on the property. | Land | Improvement |
|---|---|---|---|---|
| 2025 | $3,987 | $347,300 | $110,500 | $236,800 |
| 2024 | $3,833 | $321,800 | $98,700 | $223,100 |
| 2023 | $3,541 | $285,100 | $79,800 | $205,300 |
| 2022 | $3,226 | $254,200 | $68,900 | $185,300 |
| 2021 | $3,007 | $223,400 | $59,900 | $163,500 |
| 2020 | $3,013 | $225,500 | $70,200 | $155,300 |
| 2019 | $2,691 | $191,700 | $58,400 | $133,300 |
| 2018 | $2,632 | $182,900 | $55,600 | $127,300 |
| 2017 | $2,484 | $166,500 | $46,200 | $120,300 |
| 2016 | $2,316 | $152,800 | $42,700 | $110,100 |
| 2015 | $2,240 | $144,700 | $42,700 | $102,000 |
| 2013 | $2,100 | $139,900 | $49,300 | $90,600 |
Source: Public Records
Map
Nearby Homes
- 37 Beaudry St
- 20 Dean Ave
- 49 Sparks St
- 74 Aiken Ave
- 3 Hamel Place
- 195 Ludlam St
- 363 Hildreth St Unit 11
- 349 Hildreth St Unit 16
- 87 Lilley Ave
- 345 Hildreth St Unit 14
- 2 Sutherland St
- 39 Phoebe Ave
- 108 Billings St
- 146 Gershom Ave
- 14 Endicott St
- 94 Hampson St
- 130 University Ave
- 100 Cass Ave Unit A13
- 199 University Ave
- 70 Austin St Unit 15