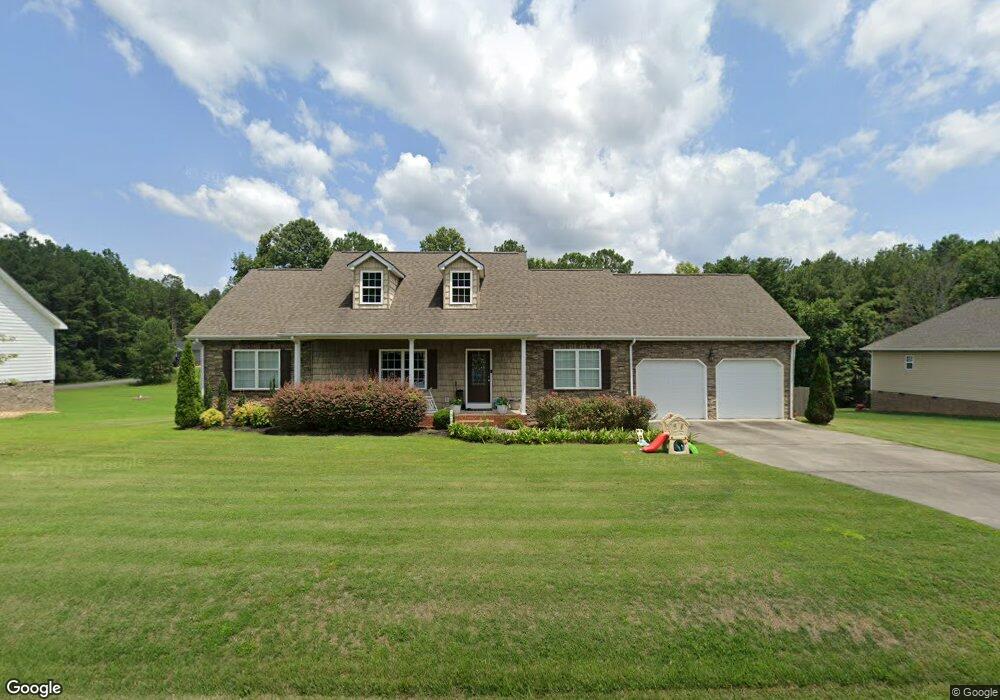
43 Bell Loop Chatsworth, GA 30705
Estimated Value: $305,495 - $344,000
3
Beds
2
Baths
1,728
Sq Ft
$190/Sq Ft
Est. Value
About This Home
This home is located at 43 Bell Loop, Chatsworth, GA 30705 and is currently estimated at $327,874, approximately $189 per square foot. 43 Bell Loop is a home located in Murray County with nearby schools including Spring Place Elementary School, Gladden Middle School, and Murray County High School.
Ownership History
Date
Name
Owned For
Owner Type
Purchase Details
Closed on
Sep 3, 2020
Sold by
Asbell Kristen B
Bought by
Guinn Emily Mashburn and Guinn Lewis Hunter
Current Estimated Value
Home Financials for this Owner
Home Financials are based on the most recent Mortgage that was taken out on this home.
Original Mortgage
$199,405
Outstanding Balance
$174,585
Interest Rate
2.8%
Mortgage Type
New Conventional
Estimated Equity
$153,289
Purchase Details
Closed on
Nov 25, 2008
Sold by
Not Provided
Bought by
Asbell Kristen B
Home Financials for this Owner
Home Financials are based on the most recent Mortgage that was taken out on this home.
Original Mortgage
$142,450
Interest Rate
6.38%
Mortgage Type
New Conventional
Purchase Details
Closed on
Apr 24, 2007
Sold by
Not Provided
Bought by
Asbell Kristen B
Purchase Details
Closed on
Aug 25, 2006
Sold by
Not Provided
Bought by
Asbell Kristen B
Create a Home Valuation Report for This Property
The Home Valuation Report is an in-depth analysis detailing your home's value as well as a comparison with similar homes in the area
Home Values in the Area
Average Home Value in this Area
Purchase History
| Date | Buyer | Sale Price | Title Company |
|---|---|---|---|
| Guinn Emily Mashburn | $209,900 | -- | |
| Asbell Kristen B | $144,400 | -- | |
| Asbell Kristen Burgess | $144,400 | -- | |
| Asbell Kristen B | $23,000 | -- | |
| Asbell Kristen B | -- | -- |
Source: Public Records
Mortgage History
| Date | Status | Borrower | Loan Amount |
|---|---|---|---|
| Open | Guinn Emily Mashburn | $199,405 | |
| Previous Owner | Asbell Kristen Burgess | $142,450 |
Source: Public Records
Tax History
| Year | Tax Paid | Tax Assessment Tax Assessment Total Assessment is a certain percentage of the fair market value that is determined by local assessors to be the total taxable value of land and additions on the property. | Land | Improvement |
|---|---|---|---|---|
| 2025 | $2,630 | $116,840 | $9,800 | $107,040 |
| 2024 | $2,632 | $113,920 | $9,800 | $104,120 |
| 2023 | $2,581 | $109,600 | $9,800 | $99,800 |
| 2022 | $2,255 | $96,000 | $9,800 | $86,200 |
| 2021 | $1,890 | $78,800 | $9,800 | $69,000 |
| 2020 | $1,635 | $66,440 | $9,800 | $56,640 |
| 2019 | $1,641 | $66,440 | $9,800 | $56,640 |
| 2018 | $1,641 | $66,440 | $9,800 | $56,640 |
| 2017 | $0 | $62,200 | $9,800 | $52,400 |
| 2016 | $1,349 | $59,440 | $9,800 | $49,640 |
| 2015 | -- | $59,440 | $9,800 | $49,640 |
| 2014 | -- | $59,440 | $9,800 | $49,640 |
| 2013 | -- | $59,440 | $9,800 | $49,640 |
Source: Public Records
Map
Nearby Homes
- 233 Bell Loop
- 172 Bell Loop
- 318 Freedom Way
- 1032 Corvette Dr
- 555 Corvette Dr
- 446 Chevelle Dr
- 0 Chevelle Dr Unit 131116
- 168 Charger Dr
- 316 Chevelle Dr
- 242 Daisy Ln
- 0 Torino Dr Unit 131322
- 871 Robinson Rd
- 0 Charlie Walls Rd
- 1656 Brown Bridge Rd
- 276 Catalina Dr
- 51 Corvette Dr
- 95 Club Trail
- 446 Brown Bridge Rd
- 2515 Greeson Bend Rd
- 61 Brown Bridge Rd
Your Personal Tour Guide
Ask me questions while you tour the home.